What is CFD?
A contract for differences (CFD) is an arrangement between a trader and a CFD broker to exchange the difference in the value of a financial product between the current value of an asset and its value at contract time.
As a derivative product, CFDs allow traders to trade in the price movement of the fast-moving global financial markets, such as on shares, indices, forex, commodities and more without ever needing to own the underlying assets. Instead, when traders trade with CFDS, he is agreeing to exchange the difference in price of the asset from the point at which the contract is opened to when its closed. As traders do not own the underlying asset, traders can profit from markets that are falling in price as well as those that are rising.
CFD traders may bet on the price moving up or downward. Traders who expect an upward movement in price will buy the CFD, while those who see the opposite downward movement will sell an opening position.
- Should the buyer of a CFD see the asset's price rise, they will offer their holding for sale. The net difference between the purchase price and the sale price are netted together. The net difference representing the gain or loss from the trades is settled through the investor's brokerage account.
- Conversely, if a trader believes a security's price will decline, an opening sell position can be placed. To close the position, they must purchase an offsetting trade. Again, the net difference of the gain or loss is cash-settled through their account.
CFDs allow investors to easily take a long or short position or a buy and sell position. The CFD market typically does not have short-selling rules. An instrument may be shorted at any time. Since there is no ownership of the underlying asset, there is no borrowing or shorting cost. Also, few or no fees are charged for trading a CFD.
Instruments
We offer CFDs on a wide range of global markets, covering indices, currency pairs, commodities, cryptocurrencies, shares, and ETFs.
Advantages of a CFD
CFDs allow investors to trade the price movement of assets of financial markets. CFDs provide traders with all of the benefits and risks of owning a security without actually owning it or having to take any physical delivery of the asset. CFDs are traded on margin meaning the broker allows investors to borrow money to increase leverage or the size of the position to amply gains. Brokers will require traders to maintain specific account balances before they allow this type of transaction.
Global market access from one platform and variety of trading opportunities. We offer products in all the world's major markets. This enables traders interested in diverse financial vehicles to trade CFDs as an alternative to exchanges.
Disadvantages of a CFD
If the underlying asset experiences extreme volatility or price fluctuations, the spread on the bid and ask prices can be significant. Paying a large spread on entries and exits prevents profiting from small moves in CFDs decreasing the number of winning trades while increasing losses.
Since CFDs trade using leverage, investors holding a losing position can get a margin call from their broker, which requires additional funds to be deposited to balance out the losing position. Although leverage can amplify gains with CFDs, leverage can also magnify losses and traders are at risk of losing 100% of their investment.
Leverage
CFD trading is leveraged, which means traders only need a small deposit, known as margin – to gain full market exposure without having to commit the full cost at the outset. Trading on margin CFDs typically provides higher leverage than traditional trading. Standard leverage in the CFD market can be as low as a 2% margin requirement and as high as a 20% margin. Lower margin requirements mean less capital outlay and greater potential returns for the trader.
Say you wanted to open a position equivalent to 500 Apple shares. With a standard trade, that would mean paying the full cost of the shares upfront. With a contract for difference, on the other hand, traders might only have to put up 5% of the cost. Profit or loss is calculated on the full value of the trade, which could mean magnified gains (but also magnified losses.)
Example of a CFD Trading
An investor wants to buy a CFD on the Vanguard S&P 500 (VOO), which is an ETF that included in the S&P 500 index. The broker requires 5% down for the trade.
The investor buys 100 shares of the VOO for $250 per share for a $25,000 position from which only 5% or $1,250 is paid initially to the broker.
**original: $250 × 100 shares = $25,000
**with CFD: $250 × 100 shares × 5% = $1,250
Two months later the VOO is trading at $300 per share, and the trader exits the position with a profit of $50 per share or $5,000 in total.
The CFD is then cash-settled, which means that the initial position of $25,000 and the closing position of $30,000 ($300 × 100 shares) are netted out, and the gain of $5,000 is credited to the investor's account.
Analysis
When trading CFDs, traders should always keep an eye on the potential downside and take care to manage the risks. We’d advise our traders to trade by using fundamental analysis and technical analysis.
Fundamental Analysis:
Fundamental analysis evaluates securities by attempting to measure their intrinsic value. To be able to use fundamental analysis, it is essential to understand how economic, financial, social, and political forces will impact the said instruments. Which means traders also requires a good understanding of macroeconomics and geopolitics.
For example, in understanding the fundamental analysis in forex, among the most used key indicators including the economic news (GDP, PMIs, CPI, PPI, retail sales, industrial production, etc) and the role of central banks.
While for stocks, analysts will look for the company performance and health, news headlines, management of individual companies, including the earnings, revenue, projected growth or profit margins, expenses, assets and liabilities, not to mention industry conditions and overall economy.
There are many economic indicators, and even more private reports, that can be used to evaluate the fundamentals. It's important to take the time to not only look at the numbers but also understand what they mean and how they affect a nation's economy. When properly used, these indicators can be an invaluable resource for any traders.
Technical Analysis:
Traders attempt to identify opportunities by looking at statistical trends, such as movements in a stock's price and volume. The core assumption is that all known fundamentals are factored into price, thus there is no need to pay close attention to them. Instead, the analysts use stock charts to identify patterns and trends that suggest what a stock will do in the future.
Technical analysts believe that prices move in trends, and price movements generally follow established patterns that can be partly attributed to market psychology based on the widely held belief that participants in markets react in a similar fashion when faced with similar situations.
Popular technical analysis signals include MACD, RSI, Stochastic oscillators, SMA, Bollinger Bands and momentum indicators. Briefly explained:
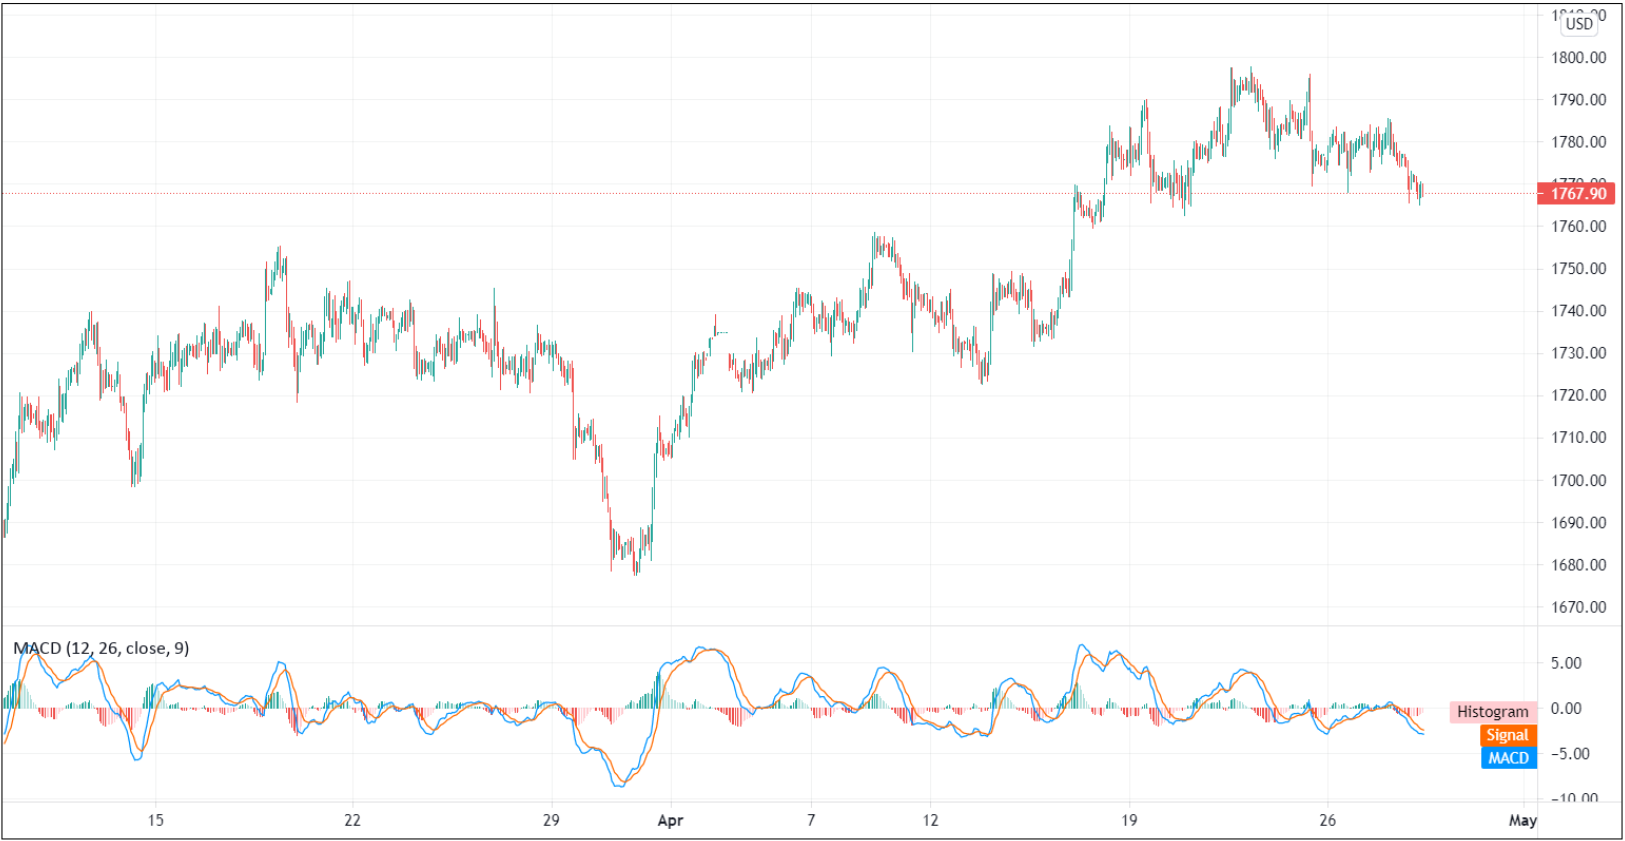
Moving Average Convergence Divergence (MACD): It is an indicator to determine price momentum and short-term trend, and it is a trend-following indicator. The MACD indicator is usually used for the short-term period trading within 1 to 14 days.
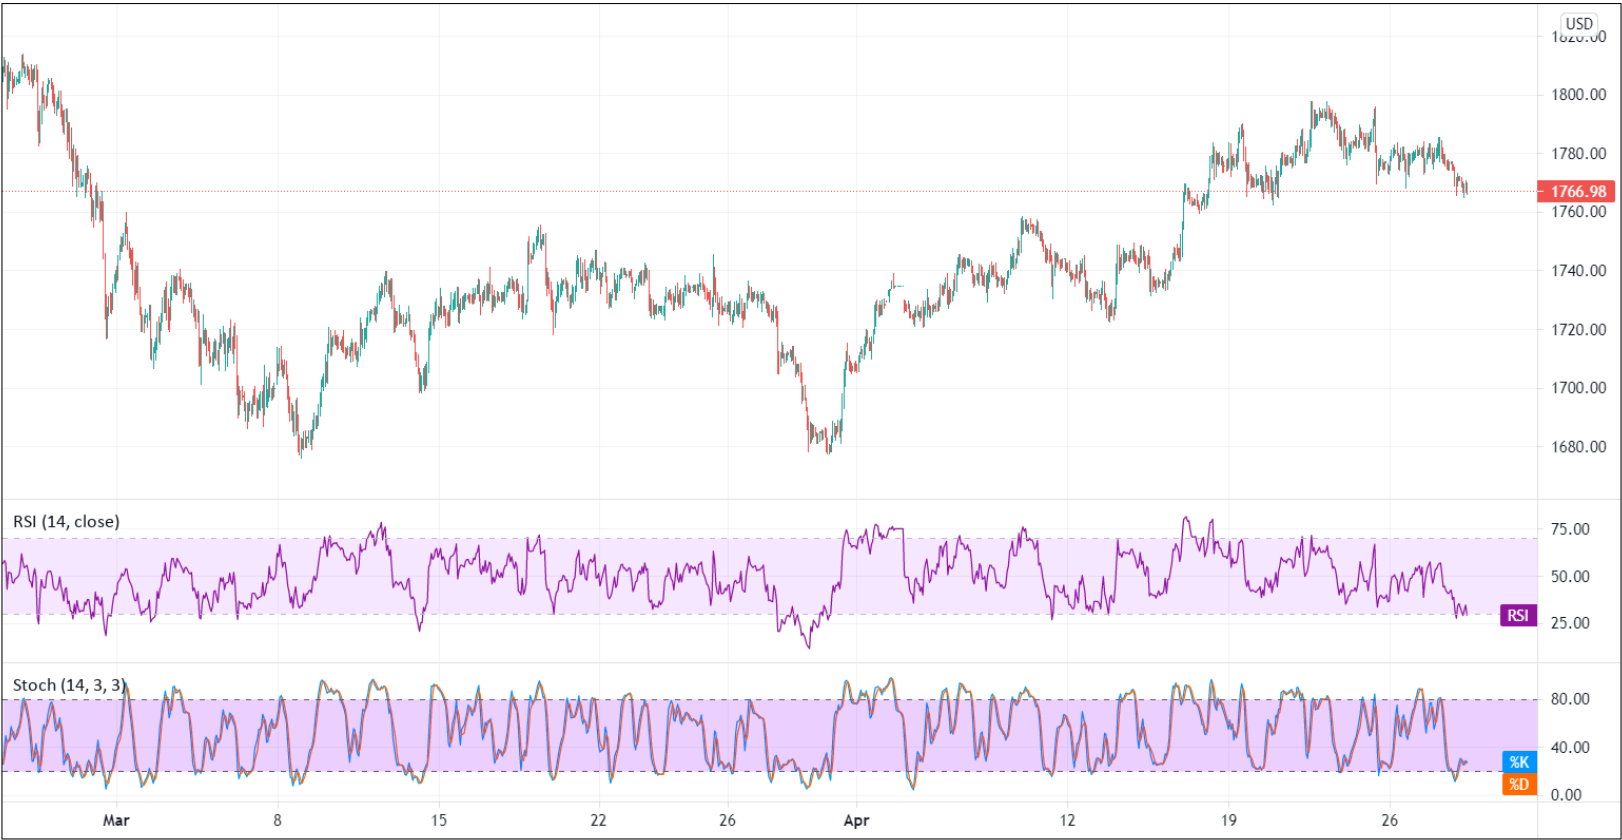
Relative Strength Index (RSI) & Stochastics Oscillators: one of the most popular oscillators a trader will use. These scales are from 0 to 100. The RSI: if the scale is over 70, this means it is overbought. If the scale is below 30, it is oversold. For Stochastics, the overbought level is 80, and the oversold level is 20.
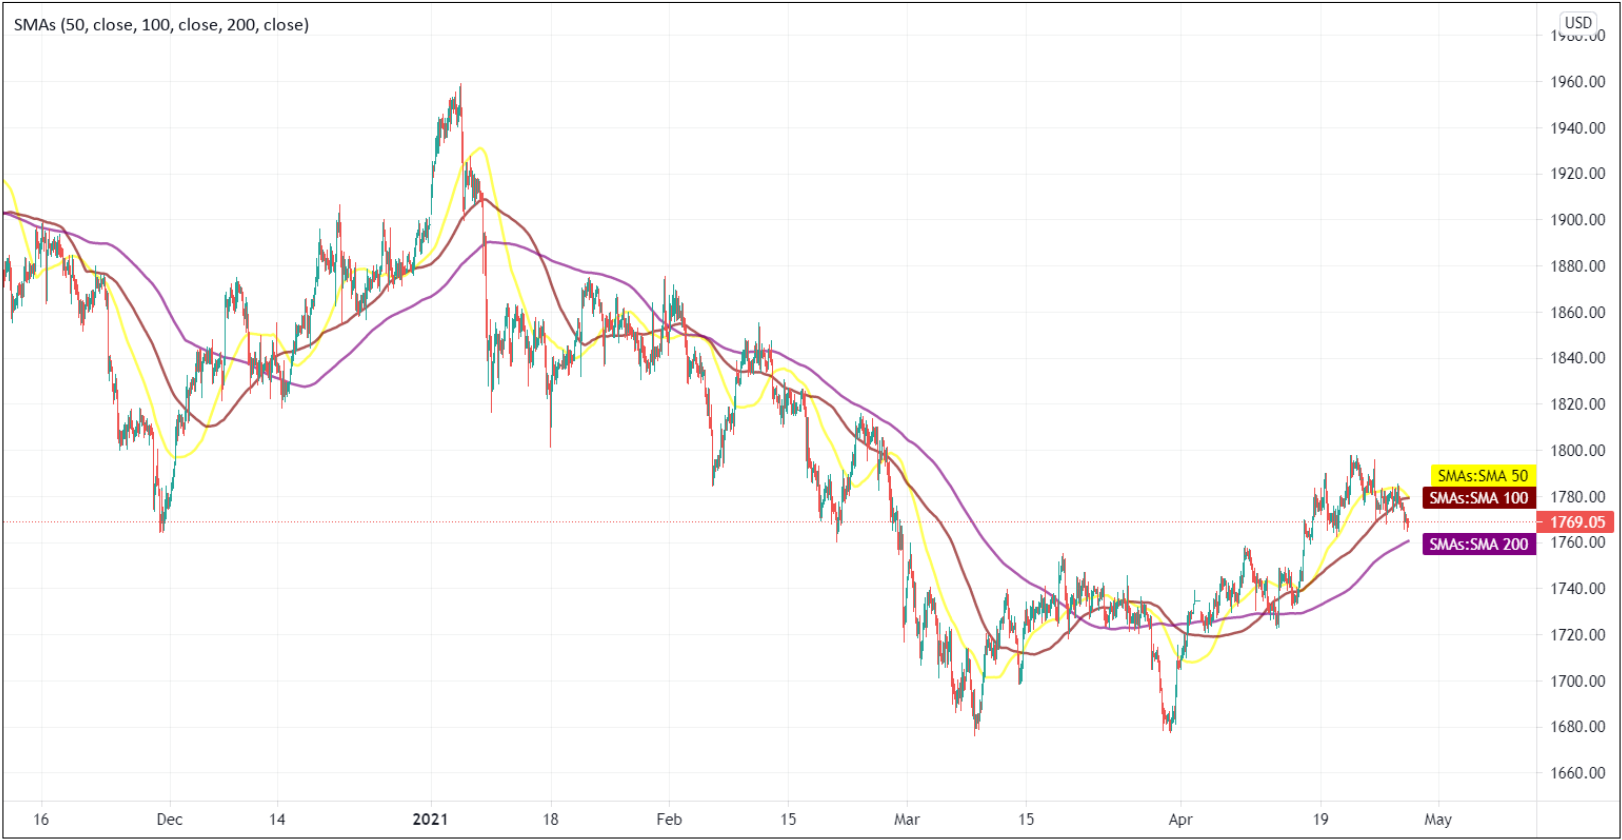
Simple Moving Average (SMA): to filter out market noise and smooth out fluctuations in price. These averages will tell you if an existing trend is still in play. Traders usually use two moving averages. Movements above and below the 20 and 40-day averages are very popular. 5 and 20-day averages are very popular for those who trade quickly.
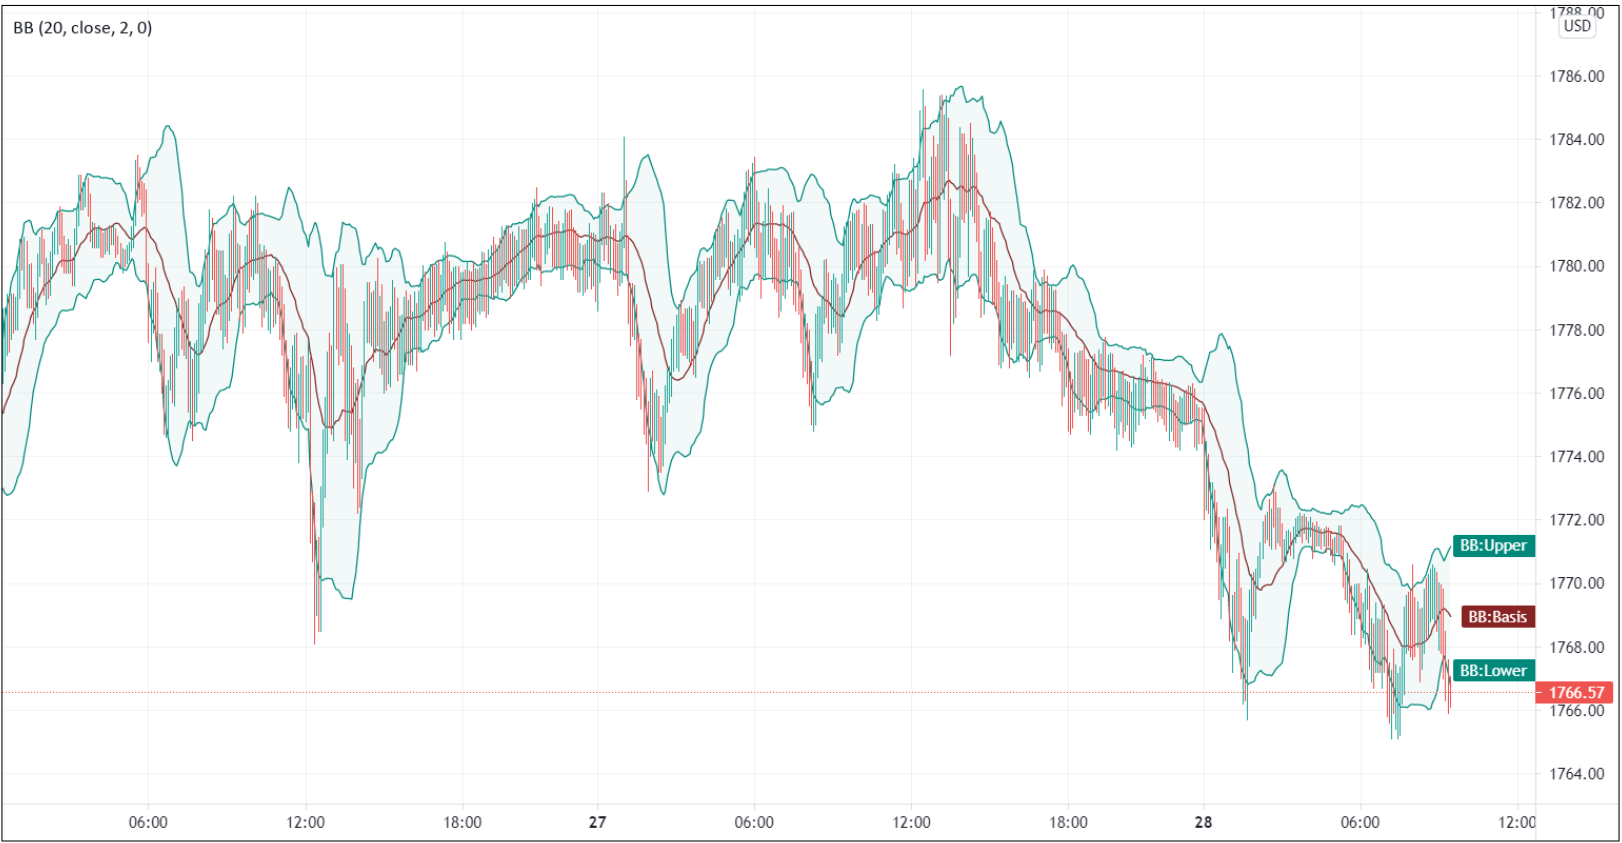
Bollinger Bands: Bollinger Bands are envelopes plotted at a standard deviation level above and below a simple moving average of the price. It is usually used to display current fluctuating changes, to confirms direction, and to warns of possible continuity or reversal of a trend.


.jpg)


