


What Is Parabolic SAR?
The parabolic SAR – or parabolic stop and reverse – is a technical indicator used to forecast the direction of a stock price, as well as describe a warning when the price direction changes. A reversal can be a bullish market changing into a bearish market, or a bearish market changing into a bullish market, while continuations signify that a market will maintain its previous momentum. A trader can use the parabolic SAR to time their entry into a long or short position.
The indicator was first introduced by J.Welles Wilder, the same trader and analyst who created the RSI indicator.
Parabolic SAR Functions
Trend Determinant - to highlight the current trend. If the point is below the candlestick, it means uptrend/bullish. Whereas if the point is at the top of the candlestick, it means it is downtrend/bearish.
Indicates Momentum - to attempt to forecast a reversal and continuation in the prevailing trend. Closer the dot is to the candlestick, the weaker the momentum.
Entry & Exit Market - to provide potential exit and entry signals during a reversal.

How To Trade Using the Parabolic SAR
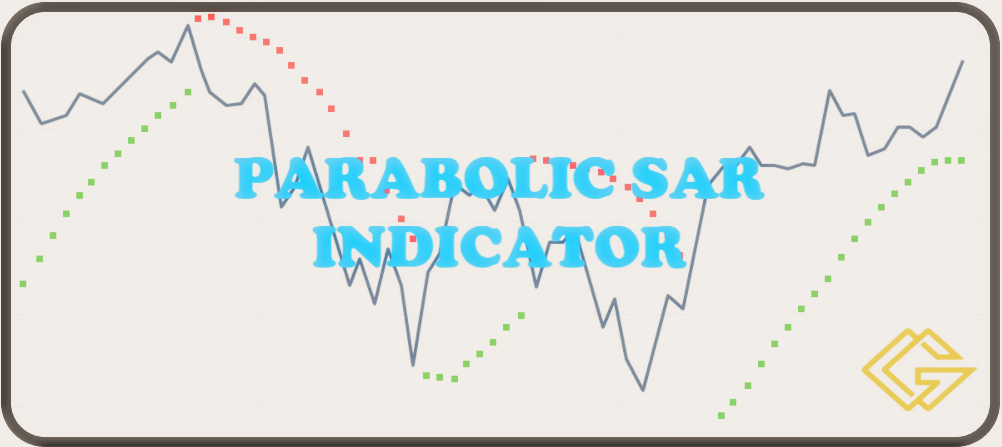
To trade using the parabolic SAR, you first need to understand what the different signals mean. The parabolic SAR will produce a series of dots – known as a parabolic line – above and below the price movements in an asset’s market chart. These dots will be either green or red.
When trading with the parabolic SAR, you would buy a market when the dots move below the current asset price and are green in colour. Alternatively, you would sell a market when the dots move above the current asset price and are red in colour.
After a series of red dots – indicating a bearish market – traders will often consider the first green dot to be a signal for a reversal from the prevailing trend. This is the time at which many will choose to close their current short position if they had one, and open a long position on the same market.
For a red dot following a series of green dots, the opposite is true. The series of green dots shows that the market is currently bullish. Then, the first red dot will often serve as a signal for a trader to close their current long position and open a short position on the same market as the trend is reversing from bullish to bearish.
Advantages and Disadvantages of Parabolic SAR
Advantages - Parabolic SAR is trend following trading strategy. If the price is trending uptrend/downtrend, this indicator provides accurate information about the trending market.
Disadvantages - Parabolic SAR can give a false signal that is the wrong signal. This indicator moves from top to bottom and vice versa while the market is in a consolidated state. This means that when the market is not good, it can move upwards.
That being said, traders should carry out another series of fundamental analysis and technical analysis of each market that to trade before opening a position. Some technical indicators that can be used alongside the parabolic SAR including the moving average indicator, the relative strength index (RSI) and the average directional index (ADX).