What Is MACD?
Moving Average Convergence Divergence or MACD was developed by Gerald Appel in the late 17s. It is an indicator to determine price momentum and short-term trend, and it is a trend-following indicator. The MACD indicator is usually used for the short-term period trading within 1-14 days.
The MACD turns two trend-following indicators, moving averages, into a momentum oscillator by subtracting the longer moving average from the shorter one, generally the 26-period Exponential Moving Average (EMA) from the 12-day period EMA. As a result, the MACD offers the best of both worlds: trend following and momentum.
MACD Elements
The MACD indicator is made up of three components:
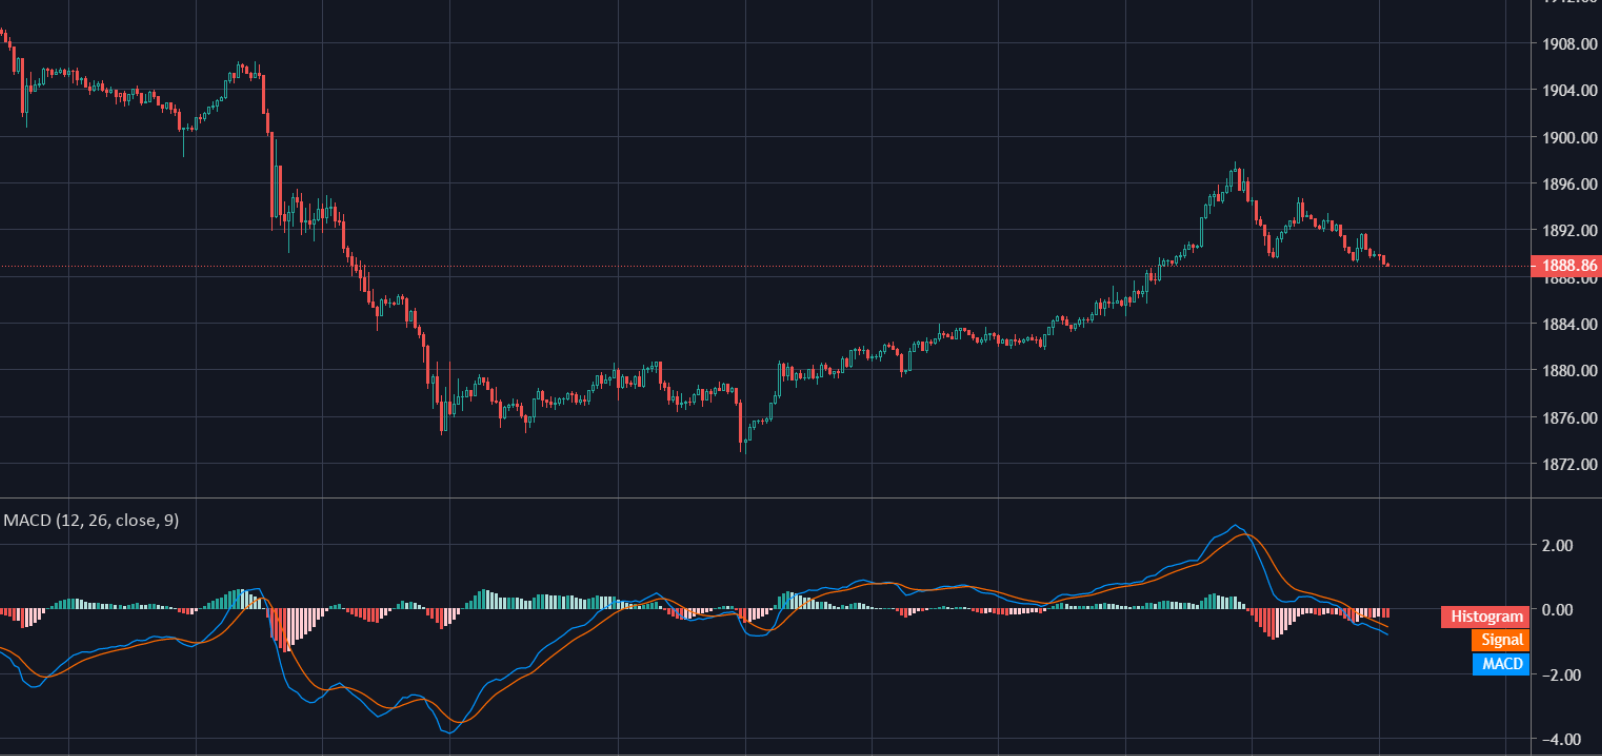
1. MACD line (blue) - The 12-day EMA minus the 26-day EMA.
2. Signal line (red) - A 9-day EMA of the MACD.
3. MACD histogram - The MACD minus the MACD Signal Line.
MACD is often displayed with a histogram which graphs the distance between the MACD line and its signal line. The 9-day EMA of the MACD called the "signal line," is then plotted on top of the MACD line, which can function as a trigger for buy and sell signals. Traders may buy the security when the MACD crosses above its signal line and sell - or short - when the MACD crosses below the signal line.
If the MACD line is above the signal line, the histogram will be above the MACD’s baseline. If the MACD is below its signal line, the histogram will be below the MACD’s baseline. Traders use the MACD’s histogram to identify when bullish or bearish momentum is high.

Uses of MACD
These MACD lines waver in and around the zero line. This gives the MACD the characteristics of an oscillator giving overbought and oversold signals above and below the zero line, respectively.
1. Trend Direction Indicator - to measure the strength of the current trend. That means there is a buy and sell signal. If the price trend is uptrend, the MACD area is in the positive zone or above level 0. While when the trend is downtrend, vice versa.
2. Entry Indicator - determine the open position during the buy and sell counter. That means we can buy or be ready to sell the counter based on the signal that comes out.
3. Momentum Measurement - measures current momentum. Momentum can be observed from the formation of the stems in the histogram. If it gets thicker it means the momentum is getting stronger, if it is getting thinner/smaller the momentum is weak.
4. Oscillator - observing overbought or oversold condition. Meaning ready to sell when entering overbought, and ready to buy when entering oversold.
MACD vs. Relative Strength
In previous write-up, we’ve talk about the Relative Strength Indicator or RSI. RSI’ aims is to signal whether a market is overbought or oversold in relation to recent price highs and lows. Meanwhile, MACD measures the relationship between two EMAs. These two indicators are often used together to provide analysts a more complete technical picture of a market.
Both indicators measure momentum in a market, but, because they measure different factors, they sometimes give contrary indications. For example, the RSI may show a reading above 70 for a sustained period of time, indicating a market is overextended to the buy side in relation to recent prices, while the MACD indicates the market is still increasing in buying momentum. Either indicator may signal an upcoming trend change by showing divergence from price (price continues higher while the indicator turns lower, or vice versa).


