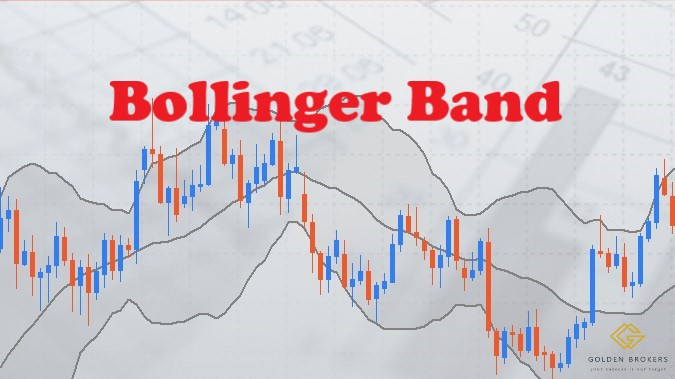
WHAT IS BOLLINGER BAND?
Bollinger Bands® are a technical analysis tool developed by John Bollinger in the early 1980s for generating oversold or overbought signals. It is defined by a set of trendlines plotted two standard deviations (positively and negatively) away from a simple moving average (SMA) of a security's price.
Bollinger Band usually used to display current fluctuating changes, to confirms direction, and to warns of possible continuity or reversal of a trend. Bollinger Band is a highly popular technique. Many traders believe the closer the prices move to the upper band, the more overbought the market, and the closer the prices move to the lower band, the more oversold the market.
THE SETTING
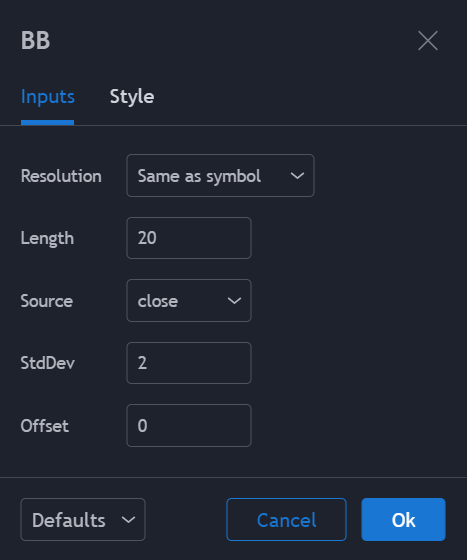
Commonly, the setting of Bollinger Band indicator is as below:

Source: https://www.tradingview.com/
Length (20) is 20 days of period observation. It is the number of candlesticks used as a calculation for 20 days, i.e. with a daily timeframe.
Source (close) - Closing prices for the first 20 days as the first data point.
StdDev is standard deviation. (2) is the default. Amplitude = Coefficient = Multiple. This means that in this BB indicator there will be 3 lines which are called standard deviations.
BOLLINGER BAND LINE
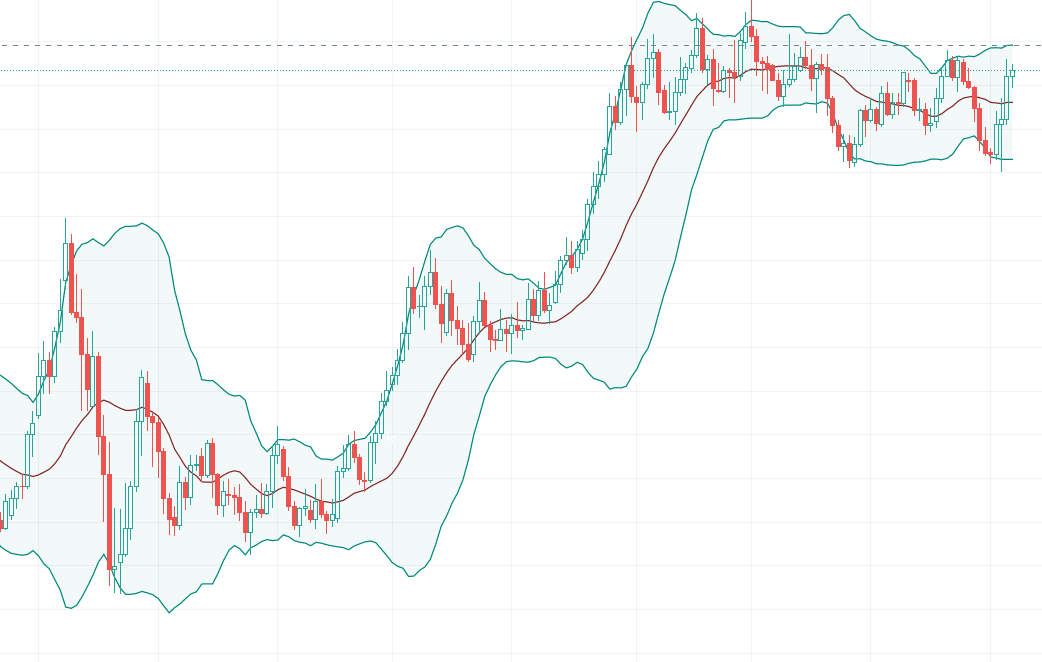
There are three lines that compose Bollinger Bands, namely Upper, Middle and Lower Band.

Upper Band (green line above) - Drawn using the standard deviation formula of MA + 2 (sd). The upper band shows a level that is statistically high or expensive.
Middle Band – It is actually a moving average (MA). If the value of 20 (length) is used for this Bollinger Bands setting, then this line symbolizes Moving Average for 20 days using daily timeframe. The Bollinger band width correlates to the volatility of the market
Lower Band (green line below) - Drawn using the standard deviation formula of MA - 2 (sd). The lower band shows a level that is statistically low or cheap.
HOW DOES THE INDICATOR WORKS
Support and Resistance - Upper band acts as resistance. Lower band acts as support.
Buy Signal - When the green candlestick comes out below the lower BB or near the middle BB.
Sell Signal - When the red candlestick is above the upper BB or falls to the middle BB.
LIMITATIONS OF BOLLINGER BANDS
Bollinger Bands are not a standalone trading system. They are simply one indicator designed to provide traders with information regarding price volatility. John Bollinger suggests using them with two or three other non-correlated indicators that provide more direct market signals. He believes it is crucial to use indicators based on different types of data. Some of his favoured technical techniques are moving average divergence/convergence (MACD), on-balance volume and relative strength index (RSI), which we’ve written out before, can be read here.


