INTRADAY TECHNICAL ANALYSIS MAY 30th (observation as of 08:00 UTC)
[EURUSD]
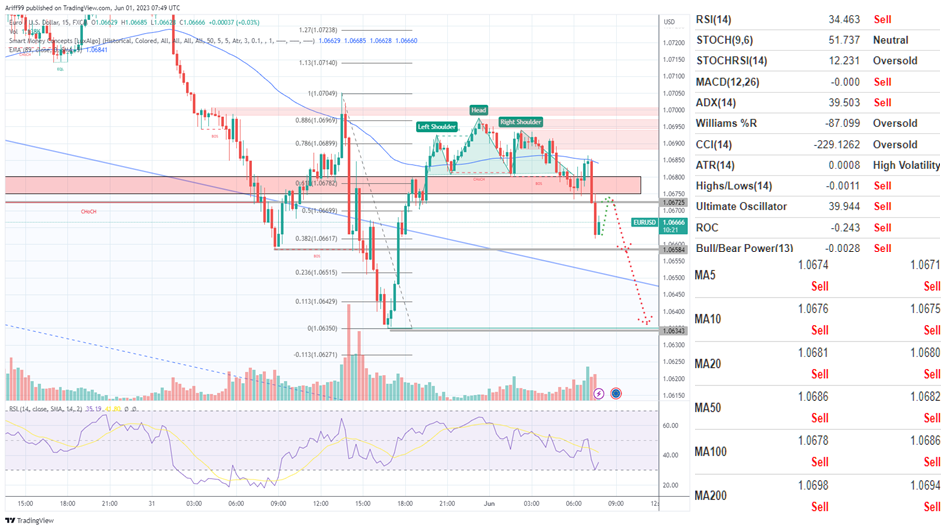
Important Levels to Watch for:
- Resistance line of 1.06725
- Support line of 1. 06584
Commentary/ Reason:
1. The price are in a strong downtrend outside the parallel bound but it recently fell into the upper bound but rebounded before forming a significant pattern.
2. The pair is now trying to either prepare to become long-term uptrend or re-enter downtrend parallel price channel and continue trending down.
3. The EU reported german retail sales to be better than expected although lower and lower CPI although core cpi is higher while the US market is expecting labour data.
4. The price is expected to trade lower but have a chance of rebounding to previous support breakage before continuing downtrend although a higher high from the head will establish longer term uptrend.
5. Technical indicator saying sell across the board with some of more sensitive indicator pointing to oversold while most moving average pointed to sell.
[USDCHF]
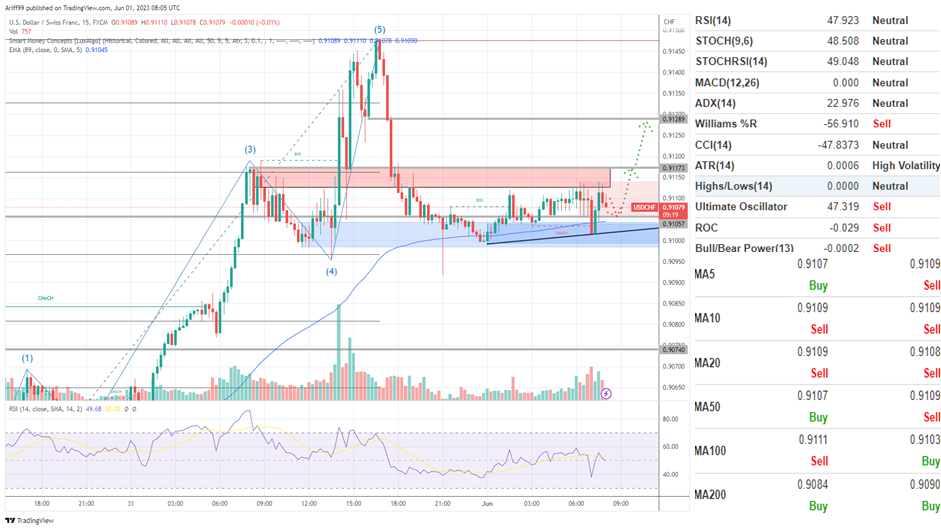
Important Levels to Watch for:
- Resistance line of 0.91173
- Support line of 0.91057
Commentary/ Reason:
1. The pair are in a strong uptrend in an impulse wave movement before reaching the endpoint which the price regressed lower before going sideways.
2. The price is now uncertain but there is some possibility of the price moving higher due to established higher lows.
3. The procure PMI from the swiss reported lower than expected while the US is awaiting labour market data.
4. The price is expected to recover to about half from the previous decline before continuing downward but a flag pattern is also possible in which a break off from higher lows trendline could be consider to be continuation.
5. Technical indicators is mixed with some saying sell but most are holding at neutral while moving average for longer term is still holding buy signals while shorter term are at sell.
[USDJPY]
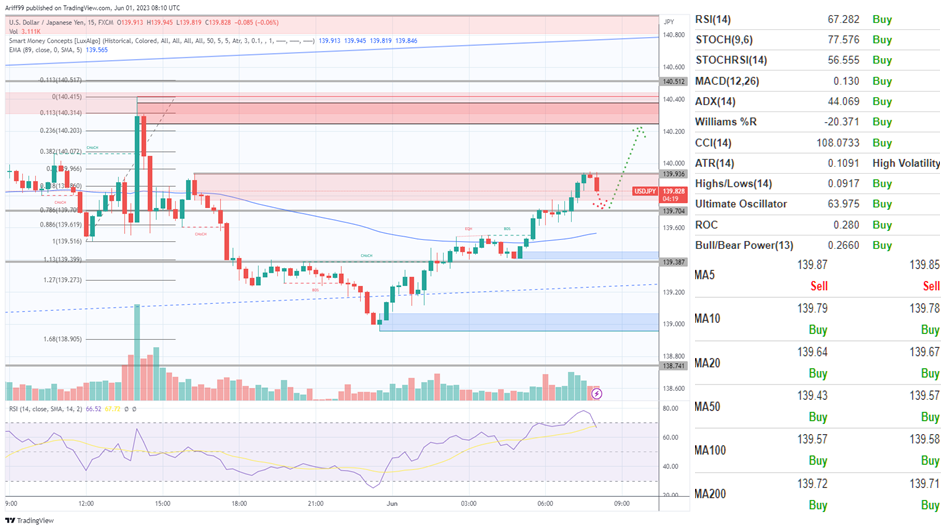
Important Levels to Watch for:
- Resistance line of 139.936
- Support line of 139.704
Commentary/ Reason:
1. The pair were on a downtrend into the middle line of a longer uptrend parallel price channel before rebounding strongly.
2. The price halted after a strong rally as it is blocked by a strong supply zone but the trend has not yet died in momentum
3. There was no significant data from the east but labour data from the US market.
4. The price is expected to be in a short pullback into the support before continuing uptrend.
5. Technical indicators are certain with all-buy while only the short period moving average are sell.
[GBPUSD]
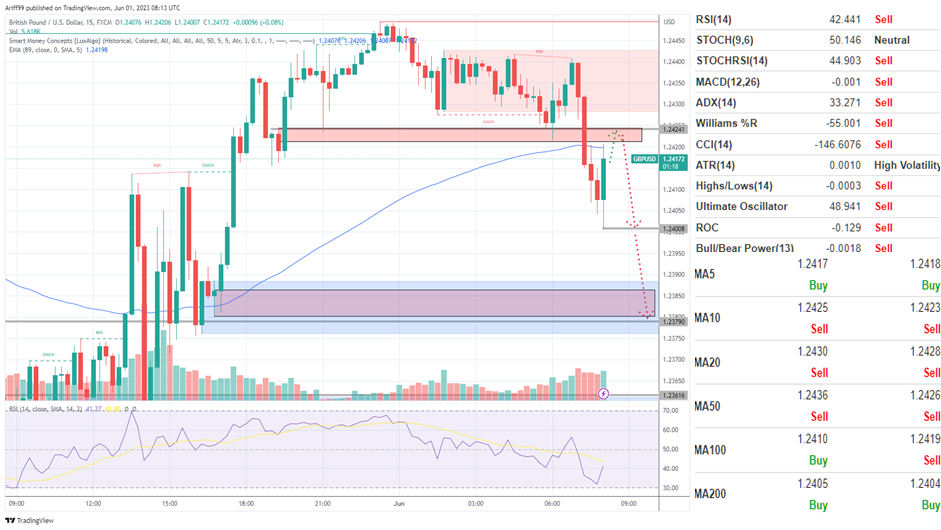
Important Levels to Watch for:
- Resistance line of 1.24241
- Support line of 1.24008
Commentary/ Reason:
1. The pair have been on uptrend since it break away from consolidation but failed to establish a higher high although it did made a higher lows.
2. The price is now pulling back from previous highs and now on track to make a higher low
3. There was better than expected nationwide HPI and manufacturing PMI data from the UK and labour market data is expected from the US later in the day.
4. The price is expected to continue upward but it would have to decline towards a higher lows probably at previous candle lows or support at demand zone around 1.23790 area.
5. Technical indicator is blaring with selling signal but some indicators are neutral while the longer term moving average are sending buying signal and shorter term moving average are saying sell.
