INTRADAY TECHNICAL ANALYSIS DECEMBER 05th (observation as of 08:00 UTC)
[EURUSD]
Important Levels to Watch for:
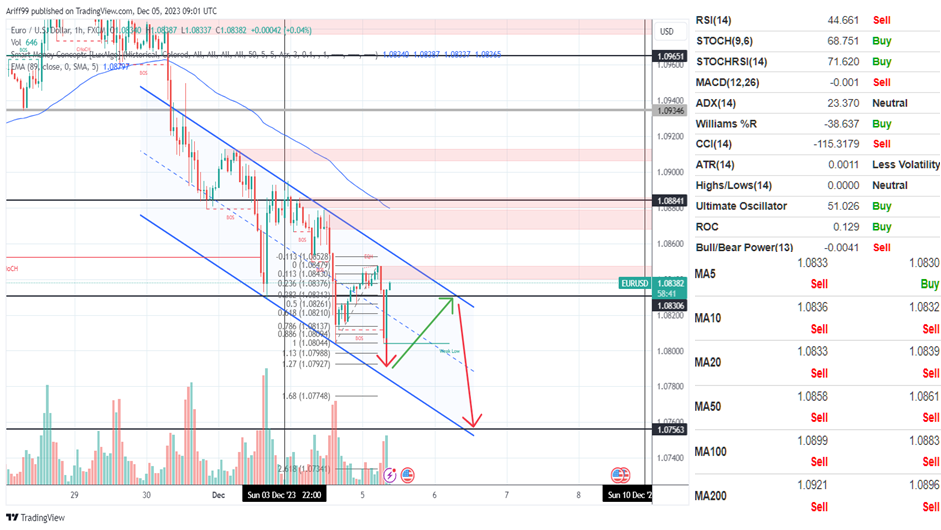
- Resistance line of 1.08306
- Support line of 1.08044
Commentary/ Reason:
1. The price have been moving in a steady downtrend that is establishing new lower lows and lower highs that coincides with the weakening of the euro although the dollar are also in a tight position after a dovish outlook by the fed.
2. While some analyst suggest that correction is imminent, its 1 year treasury are holding steady at 5.1% that show the market is still expecting the fed not cutting that much rate next year while there is possibility that the dollar will only consolidate this week.
3. Employment data and trade data from the U.S. are mostly in focus while Germany cpi for November are expected to be reported on Friday that may trigger ECB to act although the current stance is holding until inflation achieve growth target.
4. The price is expected to move in its suggested price channel unless there is a strong catalyst that may deviate it outside price channel and make it invalid. For now, the movement is prompt recovery and paired with continued downward trajectory.
5. Technical indicators are mixed with more buying than selling and some neutral while moving average are holding mostly sell after a strong downtrend since last week.

[USDCHF]
Important Levels to Watch for:
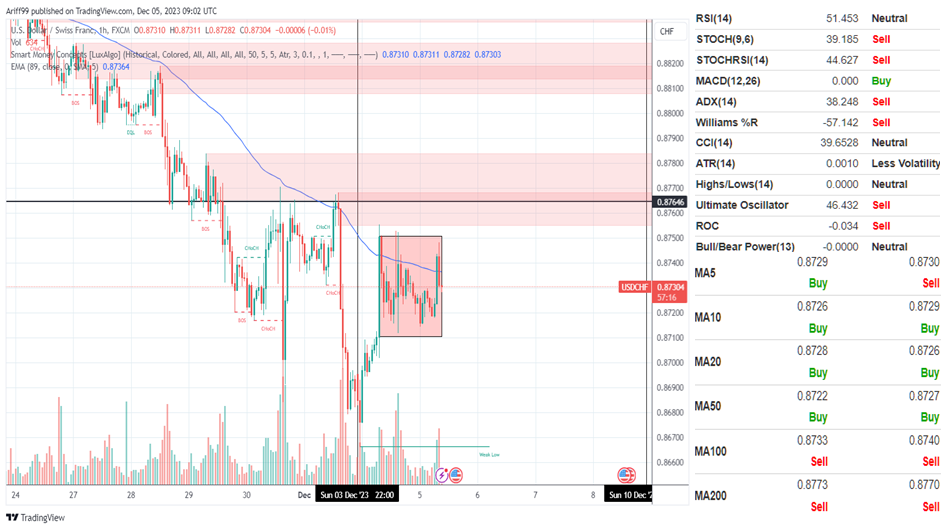
- Resistance line of 0.87500
- Support line of 0.87100
Commentary/ Reason:
1. The pair is steady with not a lot of volatility that cause the price to move frantically with no clear technical indication although it is in a downtrend as suggested by moving averages with prices often move below the averages.
2. The Swiss National Bank's have been managing its currency well that the value were less affected by the movement of the dollar.
3. Although there is no substantial economic events from the swiss, employment data and trade balance became main focus for the U.S. market.
4. The price is expected to stagnate in until they break in either direction.
5. Technical indicators are mixed with more selling than buying and some neutral although moving averages are sell long term and buy short term.

[USDJPY]
Important Levels to Watch for:
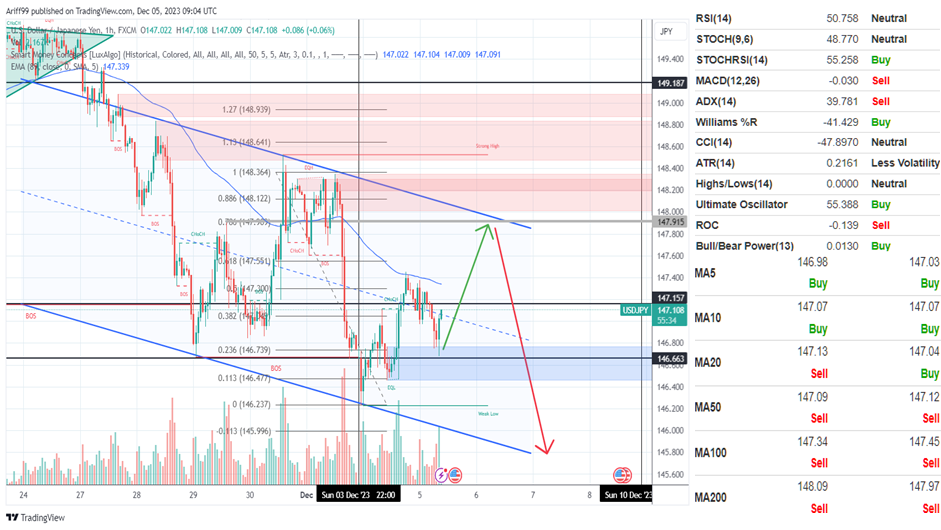
- Resistance line of 147.157
- Support line of 146.663
Commentary/ Reason:
1. The Japanese yen have been recovering from its 150 “intervention” level after the dollar weakened from dovish outlook on its fiscal policy although the recovery have been slow.
2. The shift in the fed rate cut expectation have hindered the recovery process although the price is now declining slowly toward yen advantage.
3. Japan are set to report on its Q3 GDP while the U.S. market is focused on its employment data and trade balance.
4. The price is expected to rise up to its higher resistance at 147.915 that coincides with upper bound of the price channel but there is still possibility of the prices declining earlier as the price pressure from economic data will be substantial.
5. Technical indicators are mixed with more buy than sell and neutral while longer term moving averages pointing toward a sell rather than shorter term moving averages.

[GBPUSD]
Important Levels to Watch for:
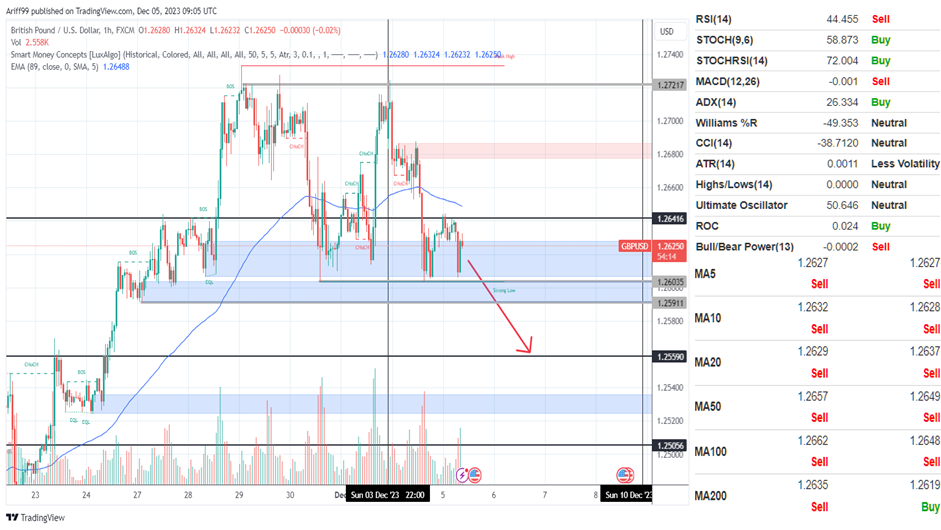
- Resistance line of 1.26416
- Support line of 1.26035
Commentary/ Reason:
1. The pair have been in a strong upward trend last week but stumbled upon a double top at the end of Friday which suggest it will weakened toward a downtrend.
2. The ECB is anticipated to cut rates by over 140 basis points in the coming year, while the first Bank of England cut is expected in June 2024, expecting more strength in the near term compared to other currency.
3. There is no substantial economic data coming from the UK while the U.S. market is focused on employment data and trade balance.
4. The price is expected push downward after testing its support level twice and pullback on a near resistance level which suggest that price could break below soon and plummet lower.
5. Technical indicator is pointing toward buy and neutral compared to sell while moving averages are pointing towards sell.


