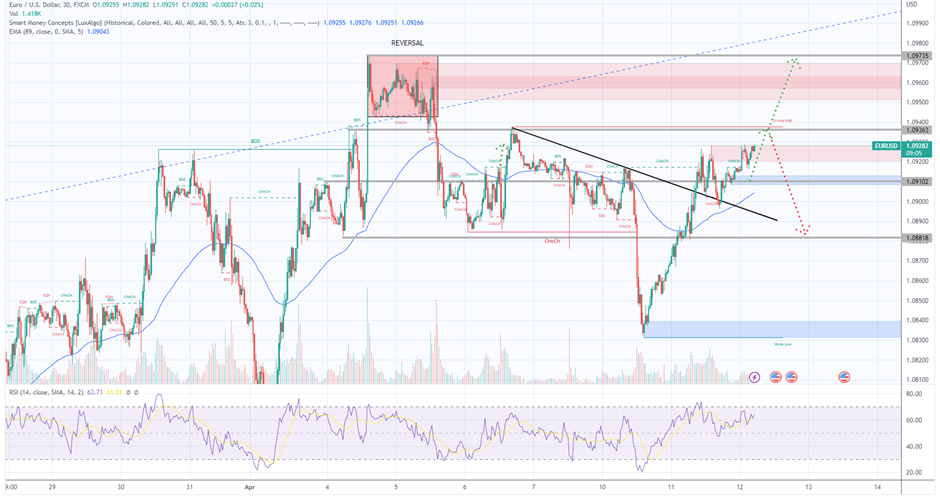
INTRADAY TECHNICAL ANALYSIS APRIL 12th (observation as of 07:31 UTC)
[EURUSD]
Important Levels to Watch for:
- Resistance line of 1.0936
- Support line of 1.09102
Commentary/ Reason:
1. The price reversed after a considerable amount of time in consolidation and have been on the downtrend for the near term while the currency is still in uptrend for the major term.
2. The Euro lost ground on Monday but regained it steadily after hawkish fed bets for quarter point hike in May.
3. Monday easter holiday is one of the reason for spike in volume that weighed down the pair.
4. The price is expected to trade in narrow range until some catalyst strong enough to move the market is out, possibly by EIA as they are publishing short term energy outlook.
5. If the price break resistance level at 1.09363, the price could test the next resistance at 1.09735. However, the price could easily fall lower as there is no price action for clear reversal.
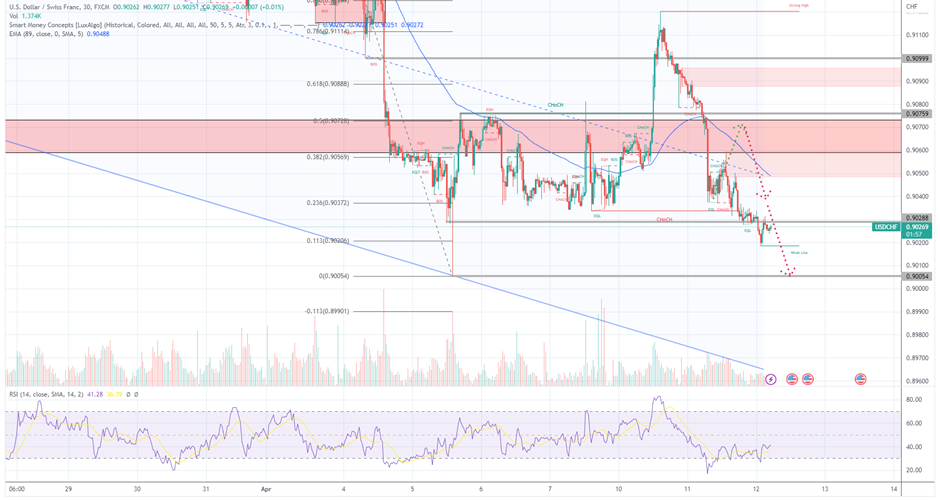
[USDCHF]
Important Levels to Watch for:
- Resistance line of 0.9028
- Support line of 0.9005
Commentary/ Reason:
1. The pair have been in strong downtrend since 3rd April with some volatility pause that continued the day after and saw a spike downward at 5th April before recovering to 50% of the price movement.
2. The price tested the support of support-become-resistance (SBR) zone of 0.906 and 0.9072 and continue to push downward as CHF strengthen against USD.
3. Swiss central bank raised rates back in March that strengthen the currency against USD, while US reported multiple weakening macro data including employment.
4. The price is expected to dive below once US CPI data are out with support at 0.9005.
5. If the price break above its resistance at 0.90288, there is reason to believe that he price will be higher and eventually break past resistance 0.9033, the next strong SBR.
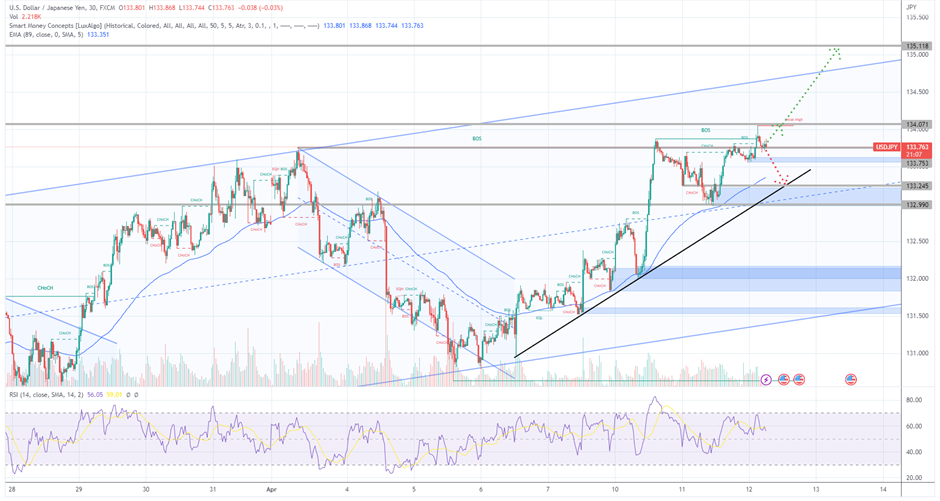
[USDJPY]
Important Levels to Watch for:
- Resistance line of 133.753
- Support line of 133.245
Commentary/ Reason:
1. The pair were previously rise sharply, breaking past multiple resistance until 133.753 where the price retraced to support 132.990.
2. The price is now uncertain in the short term, but it is showing strength in its long-term price movement.
3. Producer price index data from Japan is showing flat on the monthly and high of 7.2% YoY, indicating sticky inflation for domestic producers.
4. The price is expected to retrace to 133.245 before continuing in uptrend in a narrow range rising valleys pattern.
5. The price could break below support at 133.245 and go lower to 132.990. If the price gain to break resistance 134.071. the price could go higher to 135.118 but its highly unlikely.
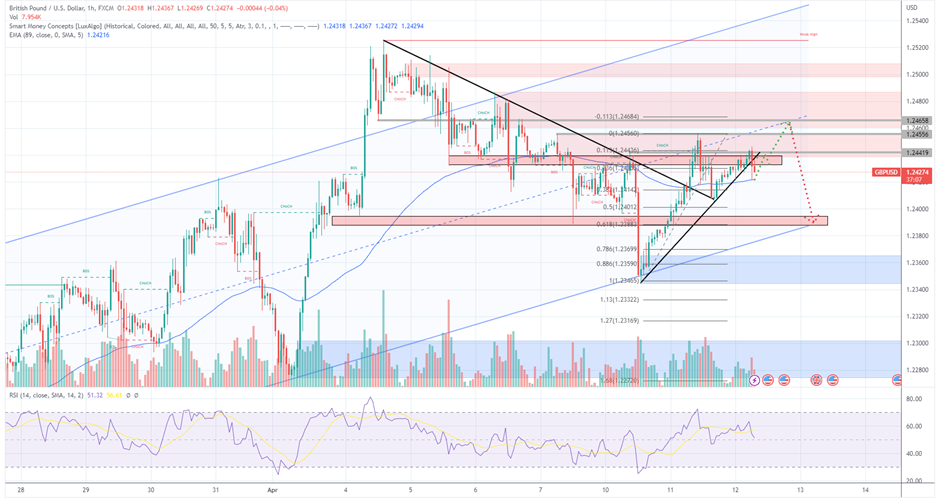
[GBPUSD]
Important Levels to Watch for:
- Resistance line of 1.2441
- Support line of 1.2388
Commentary/ Reason:
1. The pair have been on strong uptrend since March, but the price has break out of parallel channel bound and retraced back into the channel and moved downward toward its bottom channel before bouncing back.
2. The movement is probably affected by macro headwinds that pushed GBP higher as USD weakened but condition for USD have improved.
3. There is no significant news for UK market, but US CPI data will determine the price direction in the near term.
4. The price is expected to retreat lower at 1.2388 but it has short term potential to retest resistance at 12441, 1.2455, and 1.2465.
5. Fibonacci retracement saw a pullback to its 61.8% level at 1.2388. The price could either rise first before reaching that level or continue going downtrend as there is a strong bearish candle that break below trendline.
