INTRADAY TECHNICAL ANALYSIS September 05th (observation as of 08:00 UTC)
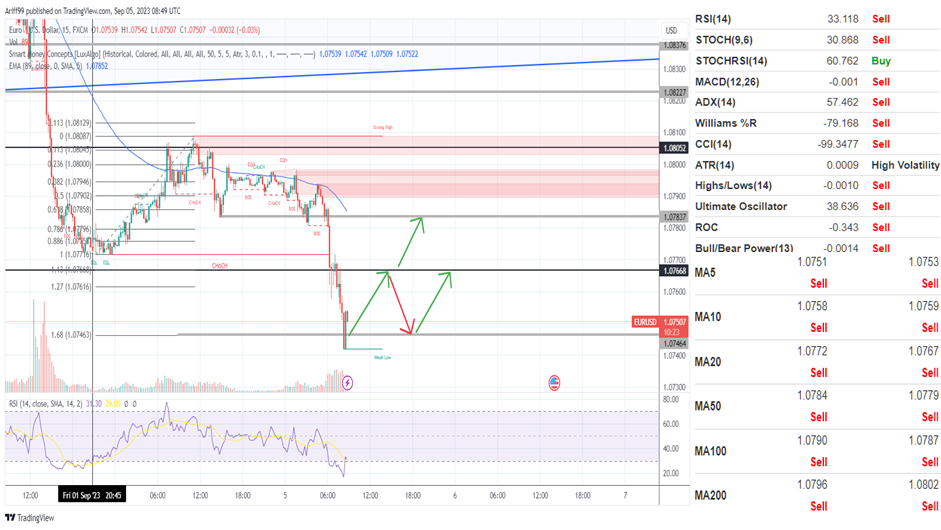
[EURUSD]
Important Levels to Watch for:
- Resistance line of 1.07668
- Support line of 1.07464
Commentary/ Reason:
1. The price have been in a strong classic downtrend with a little rebound at less than 38.2% of its previous price action then diving to 168% of the rebound range which is a signal that its at the end of the trend movement.
2. Investor is expecting the ECB to maintain its current interest rate due to slowing business and slowdown in core inflation and expectations in the coming month while the dollar are waiting for any signals to determine further rate move by the fed.
3. There is a slurry of economic data from the EU region such as Germany services PMI while the US is expecting factory orders data to determine demand for longer term goods.
4. The price is expected to rebound after reaching its previous price action target range at 168% and expected to rebound from its lows to at least resistance before continuing or even establish double bottom before returning to uptrend.
5. Technical indicators are confident with sell signals as the price fell rapidly although more sensitive stochrsi are turning buy while moving averages are flashing sell signals.

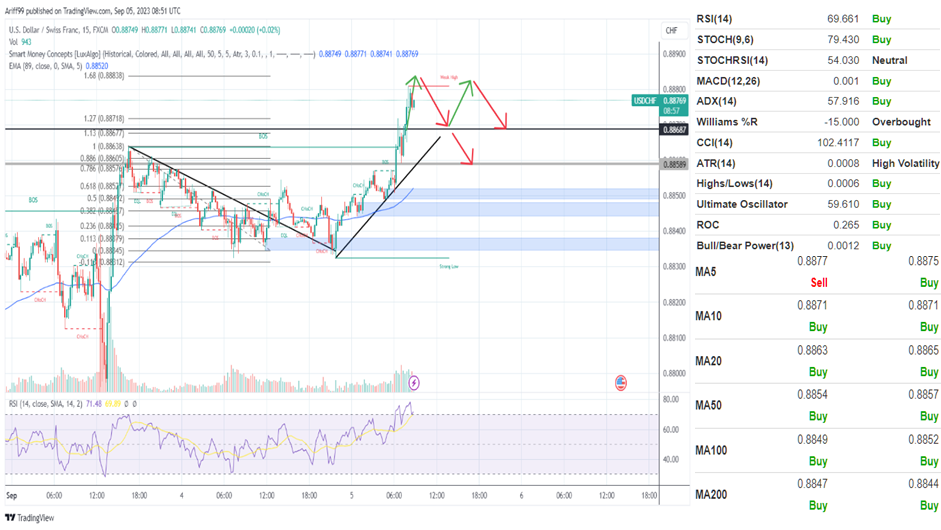
[USDCHF]
Important Levels to Watch for:
- Resistance line of 0.88838
- Support line of 0.88687
Commentary/ Reason:
1. The pair have been moving in a volatile fashion as the trend reverse from downtrend to uptrend and have been continuing to move upward after rebounding near 50% level before continuing.
2. The price was mostly due to the movement of the dollar that rally on the expectations of a hawkish fed and recovering bond yield although it still remains inflated.
3. There is none significant economic data coming from the Swiss while US is expecting a factory orders.
4. The price has already hit 168% from its previous price pullback and expected to pullback from its high and probably turn to downtrend soon.
5. Technical indicators are mostly buy as well as moving averages except the shortest one.

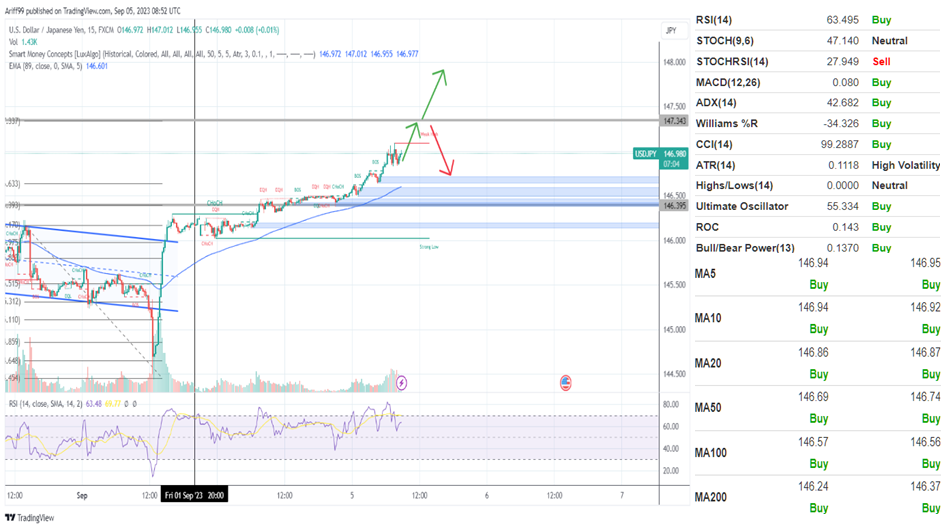
[USDJPY]
Important Levels to Watch for:
- Resistance line of 147.343
- Support line of 146.709
Commentary/ Reason:
1. The Japanese yen has been weakening from government intervention while the USD continue to strengthen that may saw it hits 150 soon which will invoke more intervention as Japanese bond market struggle to control its currency.
2. The yen currently exposed to the Chinese market largely due to stimulus from the economic power that saw commodities rising, boosting some portion of the Japanese market while the effect of cheaper exports are yet to be seen.
3. There was Japanese household spending reported on Monday which saw a sharp fall which indicate weakness in the market while the US is expecting factory orders data to give insight into its long term product purchase and business health.
4. The price is expected to continue to increase unless there is a sign from the fed that it will pause or sign from the bank of Japan that they will tweak its ultra-loose money policy.
5. Technical indicators are mostly pushing buying signals as well as moving averages.

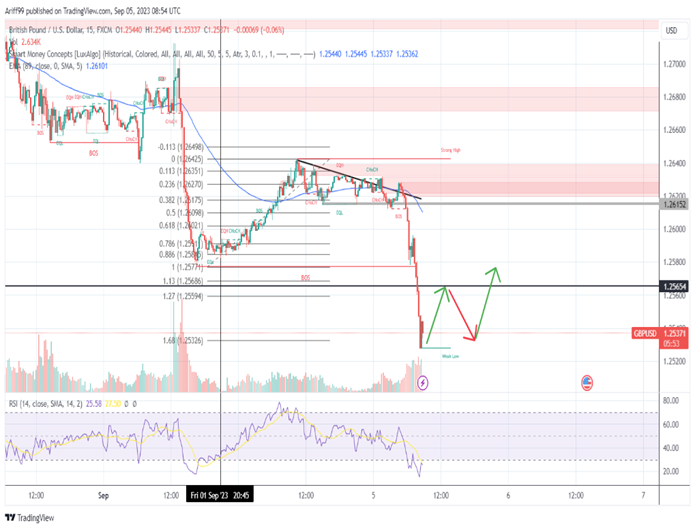
[GBPUSD]
Important Levels to Watch for:
- Resistance line of 1.26661
- Support line of 1.26156
Commentary/ Reason:
1. The pair have been moving classic downtrend pattern, rebounding to around 50% of its previous price action which is a stronger rebound but the price dipped in a short amount of time due to weak economic data from the UK.
2. Sterling dropped after poor activity data from China and Europe drove a risk off sentiment across asset classes especially commodities which has seen rising in prices.
3. There is an important economic data coming from the UK which is its PMI while the US is expecting factory orders.
4. The price is expected to rebound to atleast resistance before continuing downtrend or establish a double bottom as the price has hit its Fibonacci target of 168% of its previous rebound.
5. Technical indicator is certain with sell while some are already oversold while moving averages all blaring with sell as the price depreciated in a flash.


