INTRADAY TECHNICAL ANALYSIS FEBRUARY 22nd (observation as of 08:00 UTC)
High-Impact News:
Thursday February 22
- (EU) 05:00 ET: Eurozone CPI January
- (US) 08:30 ET: US Initial Jobless Claims
- (CA) 08:30 ET: Canada Retail Sales
- (US) 10:00 ET: US Existing Home Sales
- (US) 11:00 ET: US Crude Oil Inventories
[EURUSD]
Important Levels to Watch for:
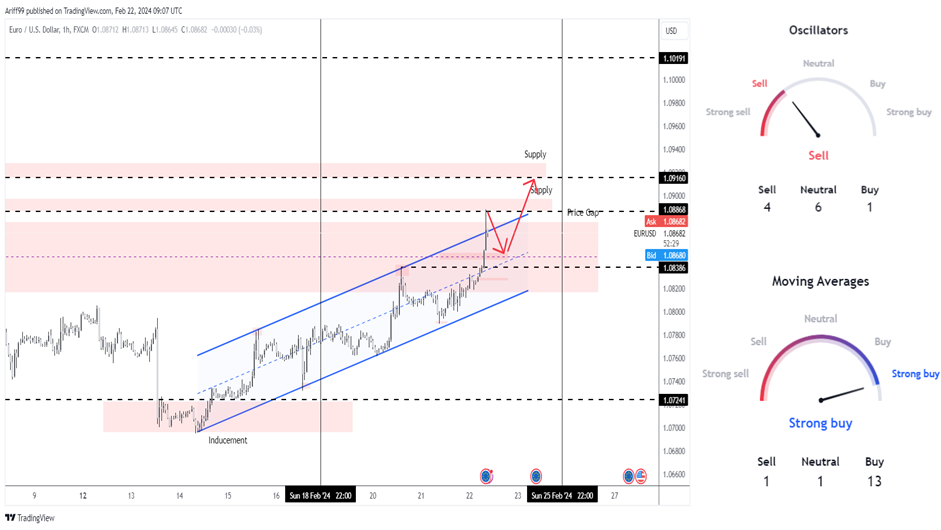
- Resistance line of 1.08868
- Support line of 1.08386
Commentary/ Reason:
1. Price on a higher timeframe have established a lower highs and in a short-term rebound that saw it whipsaw 2 months-lows marked inducement that is expected to be temporary until sell is in control again.
2. Oscillators on the 1 hour time-frame is still on sell while majority of moving averages are still on buy.
3. Price already tapped into the first supply zone and is expecting a minor pullback before having the momentum to test second supply zone although it may miss it slightly.
[USDCHF]
Important Levels to Watch for:
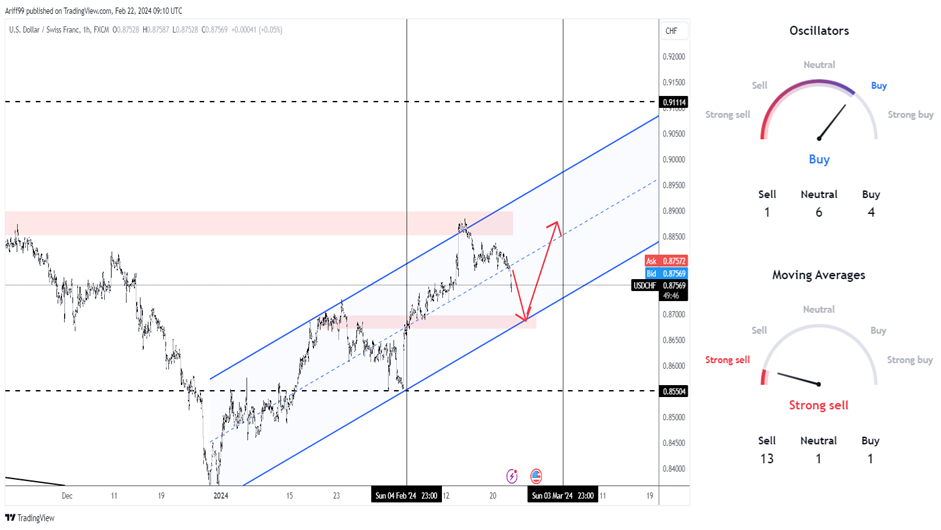
- Resistance line of 0.88800
- Support line of 0.87278
Commentary/ Reason:
1. The price on a higher timeframe have established a higher high and lower low after conversion from a bearish movement while in the shorter term are bullish with further confirmation if lower low is created.
2. Technical indicators are mostly buy for Oscillators and sell for moving averages, indicating that higher-timeframe highs are unlikely to continue unless price break above most moving averages.
3. Price is expected to test previous highs at support level before having enough momentum to retest current highs at resistance level.

[USDJPY]
Important Levels to Watch for:
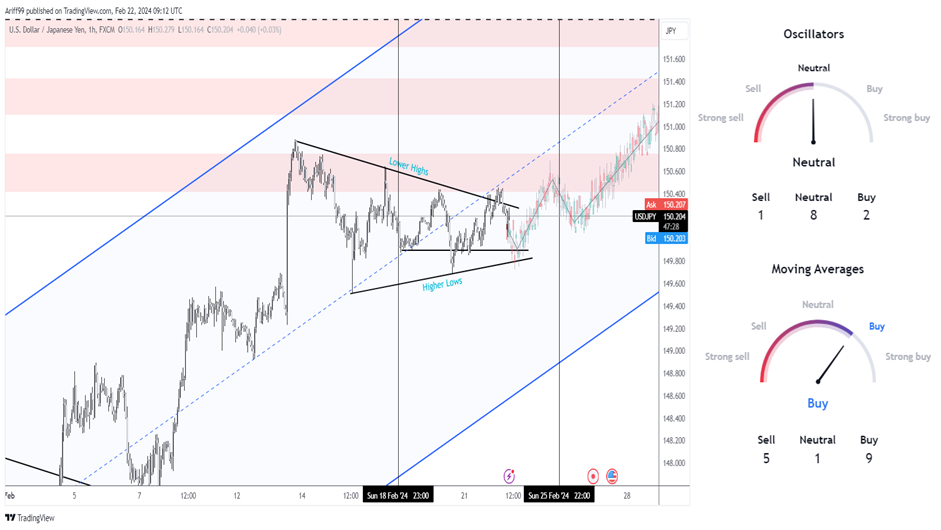
- Resistance line of 150.459
- Support line of 149.692
Commentary/ Reason:
1. The price on a higher timeframe have only established a higher lows with a stagnant highs that have been tested once, but in a shorter timeframe, price is in consolidation that is known as flag pattern.
2. Technical indicators are closer to neutral with oscillators at neutral and moving averages are weaker buy.
3. The price is projected to break above as there is multiple supply level available on top but usually these pattern will break in the opposite direction before continuing in the supposed direction.

[GBPUSD]
Important Levels to Watch for:
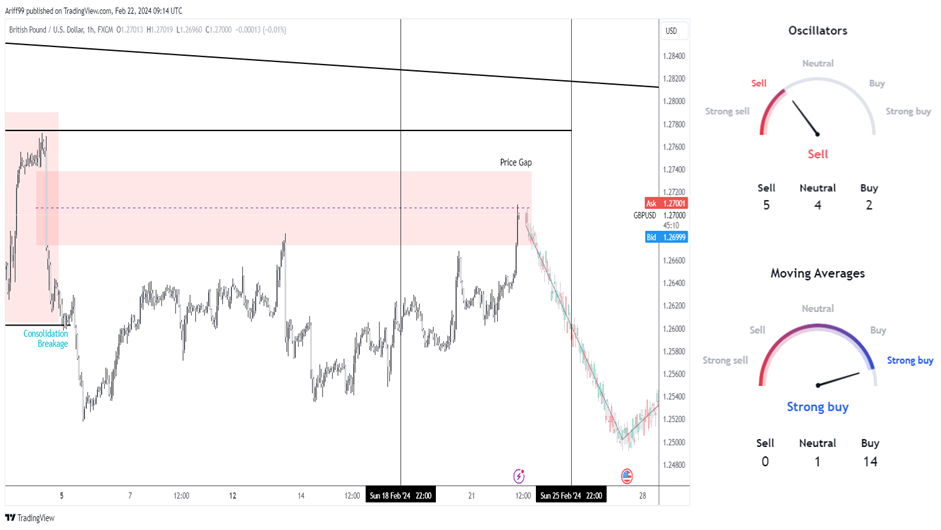
- Resistance line of 1.27737
- Support line of 1.26054
Commentary/ Reason:
1. The price on a monthly timeframe have established lower highs and lower lows but in a daily chart, the price seems to have entered a wide range of consolidation period before breaking below the rangebound and now are filling those price gaps created by the strong momentum downward.
2. The technical are mixed with oscillators on sell while moving averages are on buy.
3. The price is already filling 50% of the price gap and expected to reverse downward and possibly break below moving averages, gaining more momentum for a huge movement downward.


