INTRADAY TECHNICAL ANALYSIS APRIL 17th (observation as of 08:00 UTC)
High-Impact News:
Wednesday April 17
- (GB) 02:00 ET: UK CPI March
- (EU) 05:00 ET: Eurozone CPI March
- (US) 10:30 ET: US Crude Oil Inventories
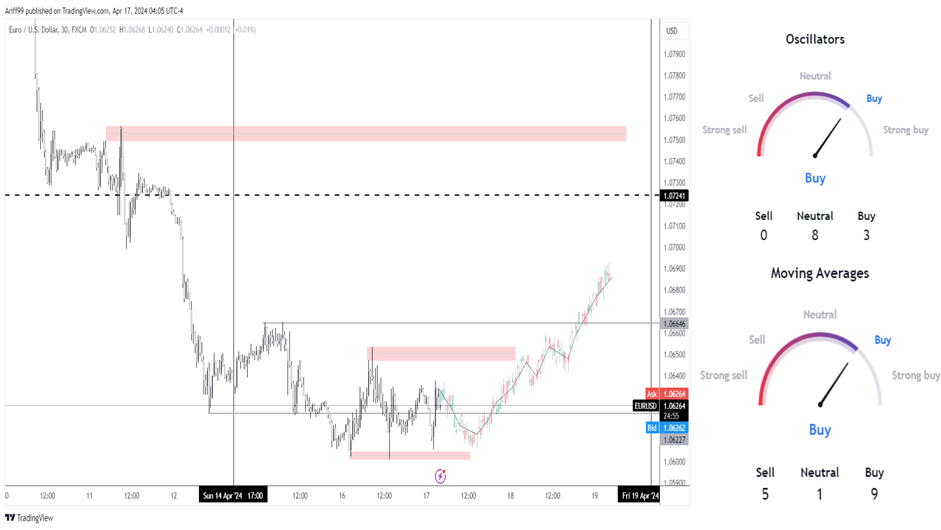
[EURUSD]
Important Levels to Watch for:
- Resistance line of 1.06646
- Support line of 1.06227
Commentary/ Reason:
1. Price on a higher timeframe have established a lower highs and in a short-term rebound that saw it whipsaw 2 months-lows marked inducement that is expected to be temporary until sell is in control again.
2. Oscillators on the 1 hour time-frame is still on sell while majority of moving averages are still on buy.
3. Price already tapped into the first supply zone and is expecting a minor pullback before having the momentum to test second supply zone although it may miss it slightly.
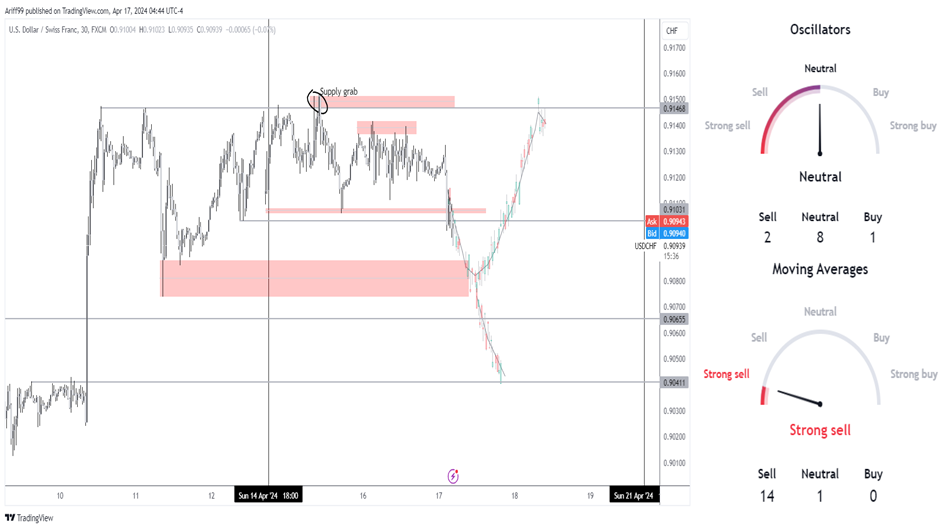
[USDCHF]
Important Levels to Watch for:
- Resistance line of 0.91031
- Support line of 0.90655
Commentary/ Reason:
1. The price on have been reluctant to break above and when it does touch it, the price pushed down which suggest that the momentum is still reversing into a downtrend although there is possibility that it will bounce back at demand zone below.
2. Technical indicators are mostly sell for Oscillators and sell for moving averages.
3. Price is expected to continue to fall into support before it has any momentum to bounce back or continue below.

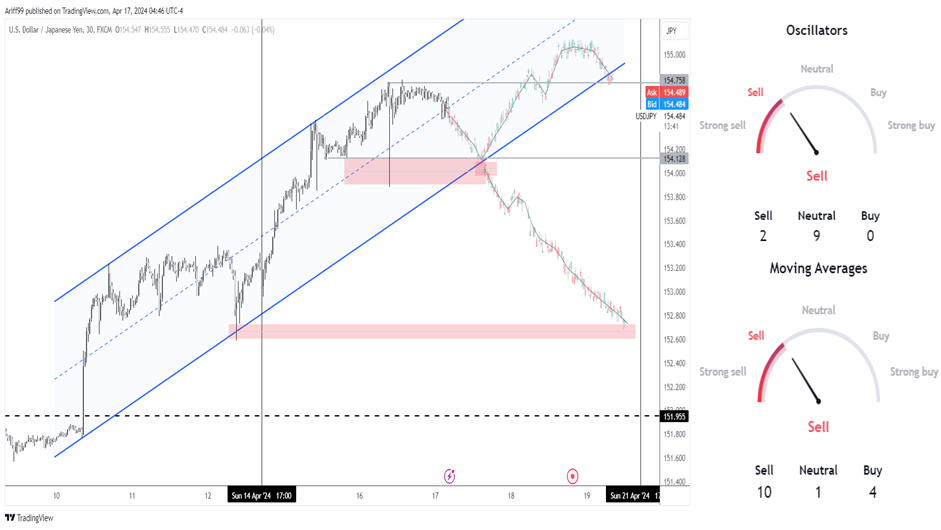
[USDJPY]
Important Levels to Watch for:
- Resistance line of 154.758
- Support line of 154.128
Commentary/ Reason:
1. The price on a higher timeframe have established higher highs and higher lows as highlighted in the price channel, with a strong wick, possibly from BoJ intervention that does not last long as more speculator are in short position against the yen.
2. Technical indicators are confidence with sell in the 30 minutes chart although the price are in uptrend.
3. The price is projected to either break below the wick or bounce back higher, although price channel suggest that the price could push higher.
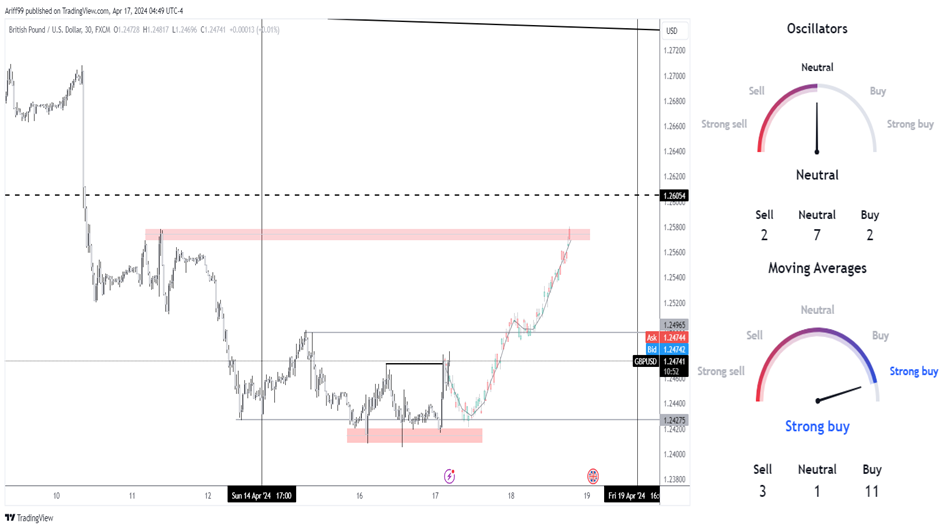
[GBPUSD]
Important Levels to Watch for:
- Resistance line of 1.24965
- Support line of 1.24275
Commentary/ Reason:
1. The price is rangebound after experiencing significant downward pressure as it enter into oversold territory with demand area tested and bounce higher, indicating higher chance of upward pressure rather than downward.
2. The technical are mixed with oscillators on neutral while moving averages are on buy.
3. The price broke tested above short term resistance before moving back down, indicating that price will have higher chance of breaking above to significant resistance level.


