INTRADAY TECHNICAL ANALYSIS MAY 23th (observation as of 08:00 UTC)
[EURUSD]
Important Levels to Watch for:
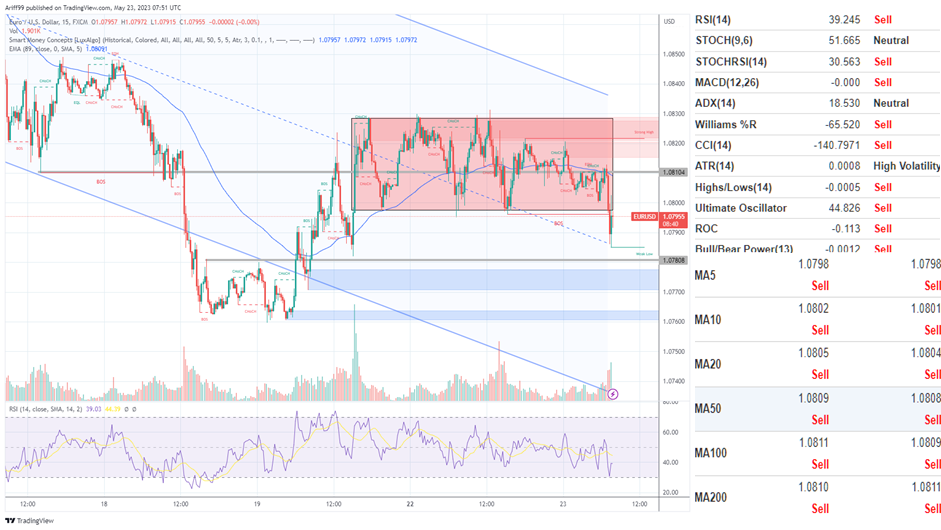
- Resistance line of 1.08104
- Support line of 1. 07808
Commentary/ Reason:
1. The price is in a sideways in a longer timeframe downtrend that could mean uncertainty as the price bounce in a certain range without breaking from its price bound.
2. The pair was on a pause as talks on debt ceiling is still in the process but the price broke below sideways bound signalling caution position for buyers.
3. The german manufacturing and services PMI came in mixed and now market are expecting the same PMI report for eurozone.
4. The price is expected to trade lower as fed officials warned of further hike which cause the price of the pair to trade lower as strengthening USD is expected.
5. Technical indicator all blaring with sell signals just after it break below sideways range including moving average.
[USDCHF]
Important Levels to Watch for:
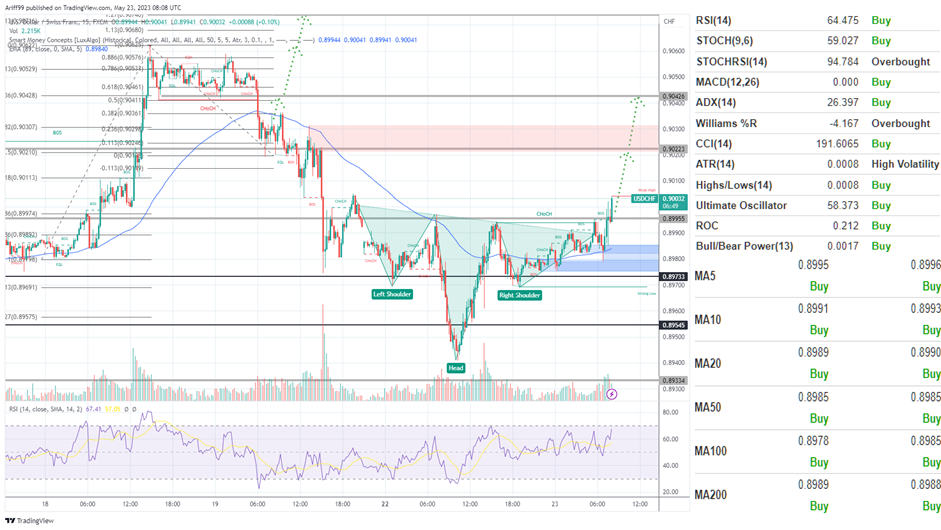
- Resistance line of 0.90223
- Support line of 0.89955
Commentary/ Reason:
1. The pair have been in strong downtrend but a reversal pattern that is inverse head and shoulder pattern emerged indicating stronger USD or weakening CHF.
2. The price have already breaking out of the pattern and is expecting to continue upward.
3. There is no significant macro data from Switzerland but building permit, service pmi, and new home sales from the US.
4. The price is expected to move further upward on strengthening dollar to 0.90426 if it comply with target price of head and shoulder theory, but resistance at 0.90223 may hinder that.
5. Technical indicators is blaring with buy signals with sensitive indicators throwing overbought signals while moving average is all buy.
[USDJPY]
Important Levels to Watch for:
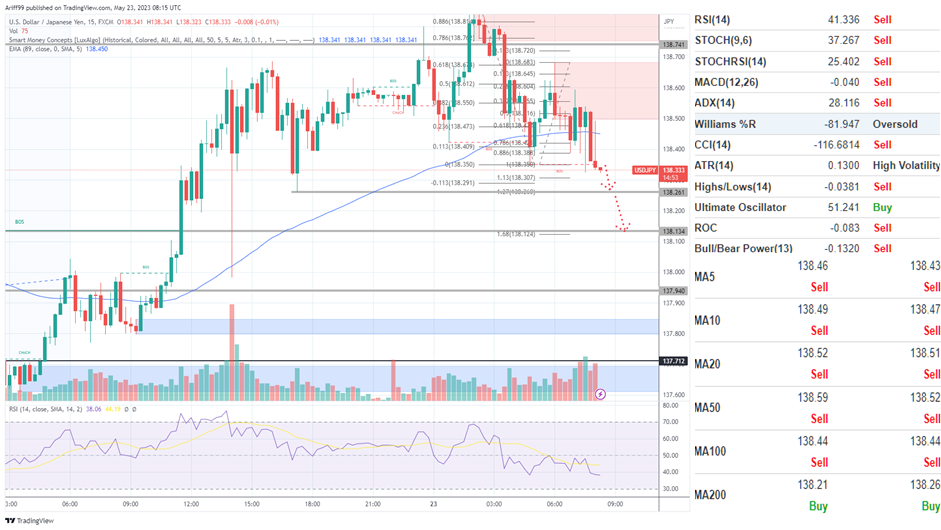
- Resistance line of 138.350
- Support line of 138.261
Commentary/ Reason:
1. The pair were on a strong uptrend but reverse once it formed a fake resistance breakout and now on a relatively strong downtrend.
2. The price was affected by strengthening USD that pushed it upward but Japan macro data that came better than expected have offset this as Nikkei 225 index have also shot upward.
3. There was strong economic data from Japan that boosted its index last week and yesterday saw better than expected manufacturing and services PMI while there is only macro data from US today that’s relevant.
4. The price is expected to continue downward to Fibonacci level of -11.3% of the downward price action or 127% of the pullback or even 168% as there is a support down there.
5. Technical indicators are showing sell across the board except ultimate oscillator and longer term moving average of 200 which is a cautionary for swing traders that may take buy position lower.
[GBPUSD]
Important Levels to Watch for:
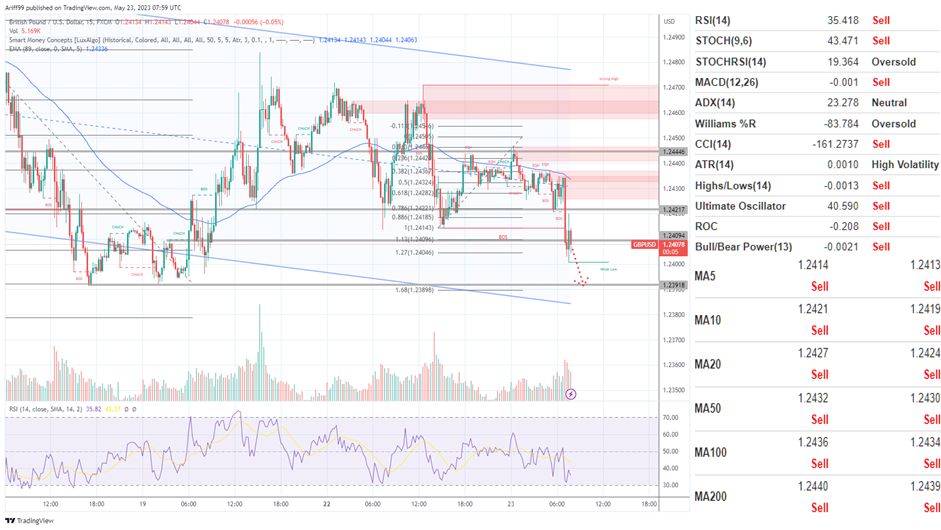
- Resistance line of 1.24217
- Support line of 1.23918
Commentary/ Reason:
1. The pair have been on a recovery but eventually fall on the shorter timeframe, now on continuation, possibly at the end of the market structure but it has a little bit more to go.
2. The price have been weaking on stronger dollar but the falling price may have a more wiggle room to keep falling.
3. There is an upcoming PMI report incoming today and building permits report from the US.
4. The price is expected to keep falling lower to Fibonacci level of 168% from its price rebound but the movement right after is uncertain.
5. Technical indicator is blaring with selling signals with more sensitive indicators is oversold and all moving average telling to sell indicating long term trend is downtrend.
