U.S. Coffee
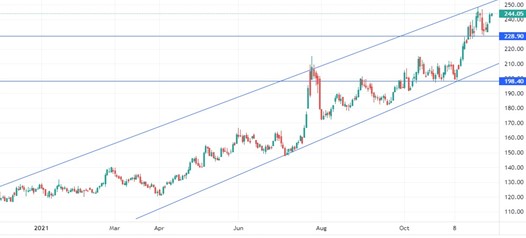
The Coffee C benchmark is the global benchmark for Arabica coffee, currently valued at $2.42 per pound. This figure remains close to its highest levels since October of 2011, with the boost in price being caused by several factors. Since the beginning of 2021, the performance of coffee has rocketed by 89%, caused by several environmental events in Brazil, which accounts for 35% of global coffee exports. Frost and drought in the South American nation has destroyed crops. If frost causes maximum damage, a potential two-thirds of trees can be damaged. Since coffee takes around 5 years to grow, this could significantly limit supply, which in turn boosts prices.
Not only that, but excessive rains in Colombia, another large coffee exporter, and a shortage of shipping containers in Vietnam have also limited supplies. The USDA (United States Department of Agriculture) estimated in its latest report that coffee production and consumption on a worldwide scale would increase, due to higher shipping costs, soaring cost of fertilizers and ongoing labor shortages. As a result, the Coffee C benchmark could break the $3 and even $4 barrier, should such factors persist in the long-term, hand-in-hand with the spread of Omicron.
Natural Gas
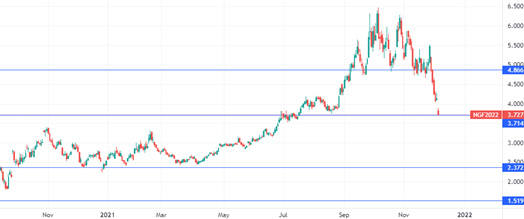
On the supply side, amount of gas production, level of gas in storage, and volume of gas imports & exports affect natural gas. On the demand side, weather variations, economic growth, and the availability & prices of substitute fuels impact natural gas. Since 2008, natural gas prices have been dropping but has seen significant changes since mid-2020, especially the past year. Natural gas prices have doubled since last year, sitting currently at $3.8 per million British thermal units (MMBtu), a level unwitnessed since mid-July, and previously in December of 2018. This is due to several factors. Demand is rebounding as consumers return to pre-pandemic activities. At the same time, producers, which suffered in the unprecedented downturns of 2020, have been reluctant to increase output quickly.
Much of the future expectations depend on the winter weather. A colder winter means demand for heating will increase, which is expected to boost natural gas prices. JP Morgan has raised its 2022 average price forecast by $1.70 MMBtu to $4.81 MMBtu.
Oil (Brent & WTI)
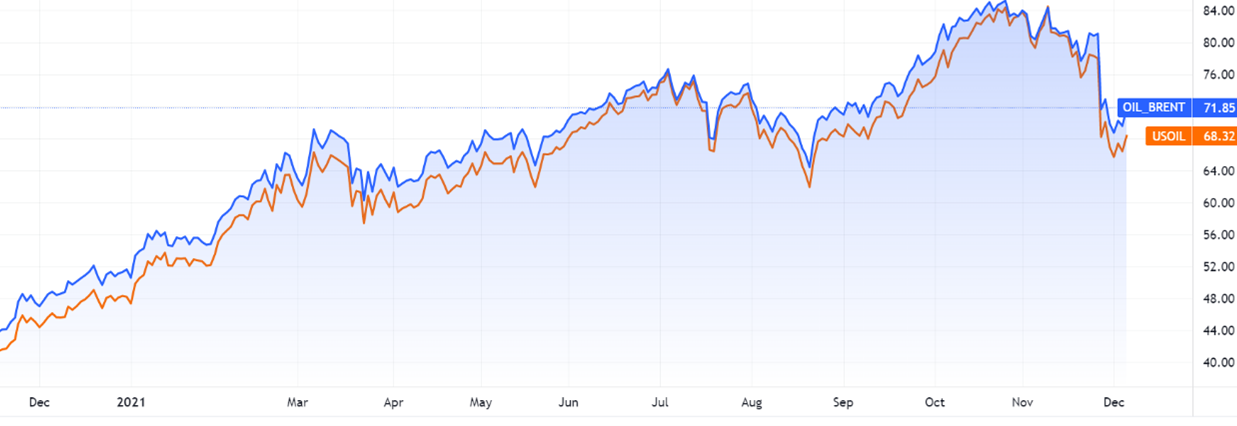
Oil has always been an attractive trading option, as it’s quite volatile, useful in balancing price movements and it’s simple to trade. Since the birth of the pandemic in the end of 2020, demand for oil has been heavily damped amid travel restrictions and lockdowns. The Saudi-Russia dispute caused the market to be flooded with oil, driving future contract prices to negative $40 per barrel at some point. But, things have been quite different for oil in 2021.
Oil had an impressive year, with the American-benchmark WTI oil performing 40% better in this year, and the London-based Brent oil recording an impressive 38.6% rise in value. Crude oil prices increased significantly in the third quarter of this year, lifted by several drivers. Increased demand in Europe and China was the result of removing lockdown measures. Another driver would be the weather-related supply issues. U.S. production was affected by Hurricane Ida while the Organization of Petroleum Countries (OPEC) and its allies produced 1 million barrels/day below their quota, due to maintenance and supply disruptions. A third driver would be the falling oil inventories, which were dropping by over 1% per month since August of last year. However, the spread of Omicron has increased investor concerns, plummeting oil 10% in the biggest one-day fall since April of 2021 due to the fear arising from the potential renewal of global travel restrictions. With the rise of energy prices and a potential colder-than-expected winter season, oil prices could surge once again.
U.S. Cotton
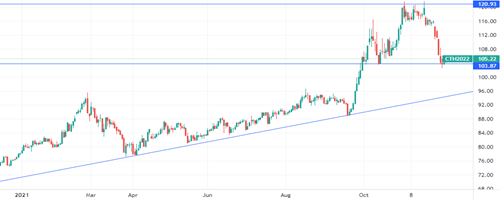
U.S. cotton futures saw an impressive 34.6% performance jump in 2021. In fact, cotton futures have been on the rise since the beginning of the year, but has witnessed its best quarters in Q3 amid tight supply caused by a drought in the United States, which limited production ahead of the holiday shopping season. The price boost can also be attributed to poor weather, which hurt crops around the world with decreased demand for fiber from the U.S., the top exporter. The last time cotton prices were this high was back in July of 2011.
Increased cotton prices have pushed retailers and manufacturers to hike raw materials cost, and in turn, the average price of a cotton t-shirt for a consumer rose about $1.5 to $2 on average. However, the U.S. is reportedly aiming to expand cotton exports to Bangladesh, which the world’s largest cotton importer behind Pakistan, and such move can settle cotton prices.
U.S. Wheat
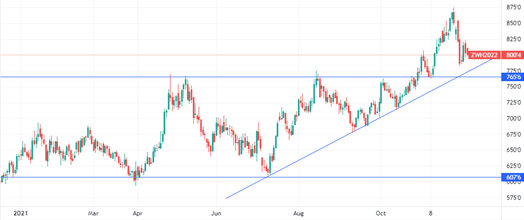
Last but not least on our list is U.S. wheat, which climbed close to 25% in value. Wheat rose to 9-year highs due to worsening conditions of U.S. winter crops, raising concerns over global supply amid strong demand. Wheat has extended its rally after the USDA lowered its U.S. and global supply forecasts for the 2021/2022 year. The department forecasts that all wheat production in the United States shall hit 1.697 billion bushels, which is 49 bushels down from previous estimations. This has pushed wheat prices upwards to record highs, with investors expecting prices to keep surging should supply remain limited amid the spread of Omicron.


